


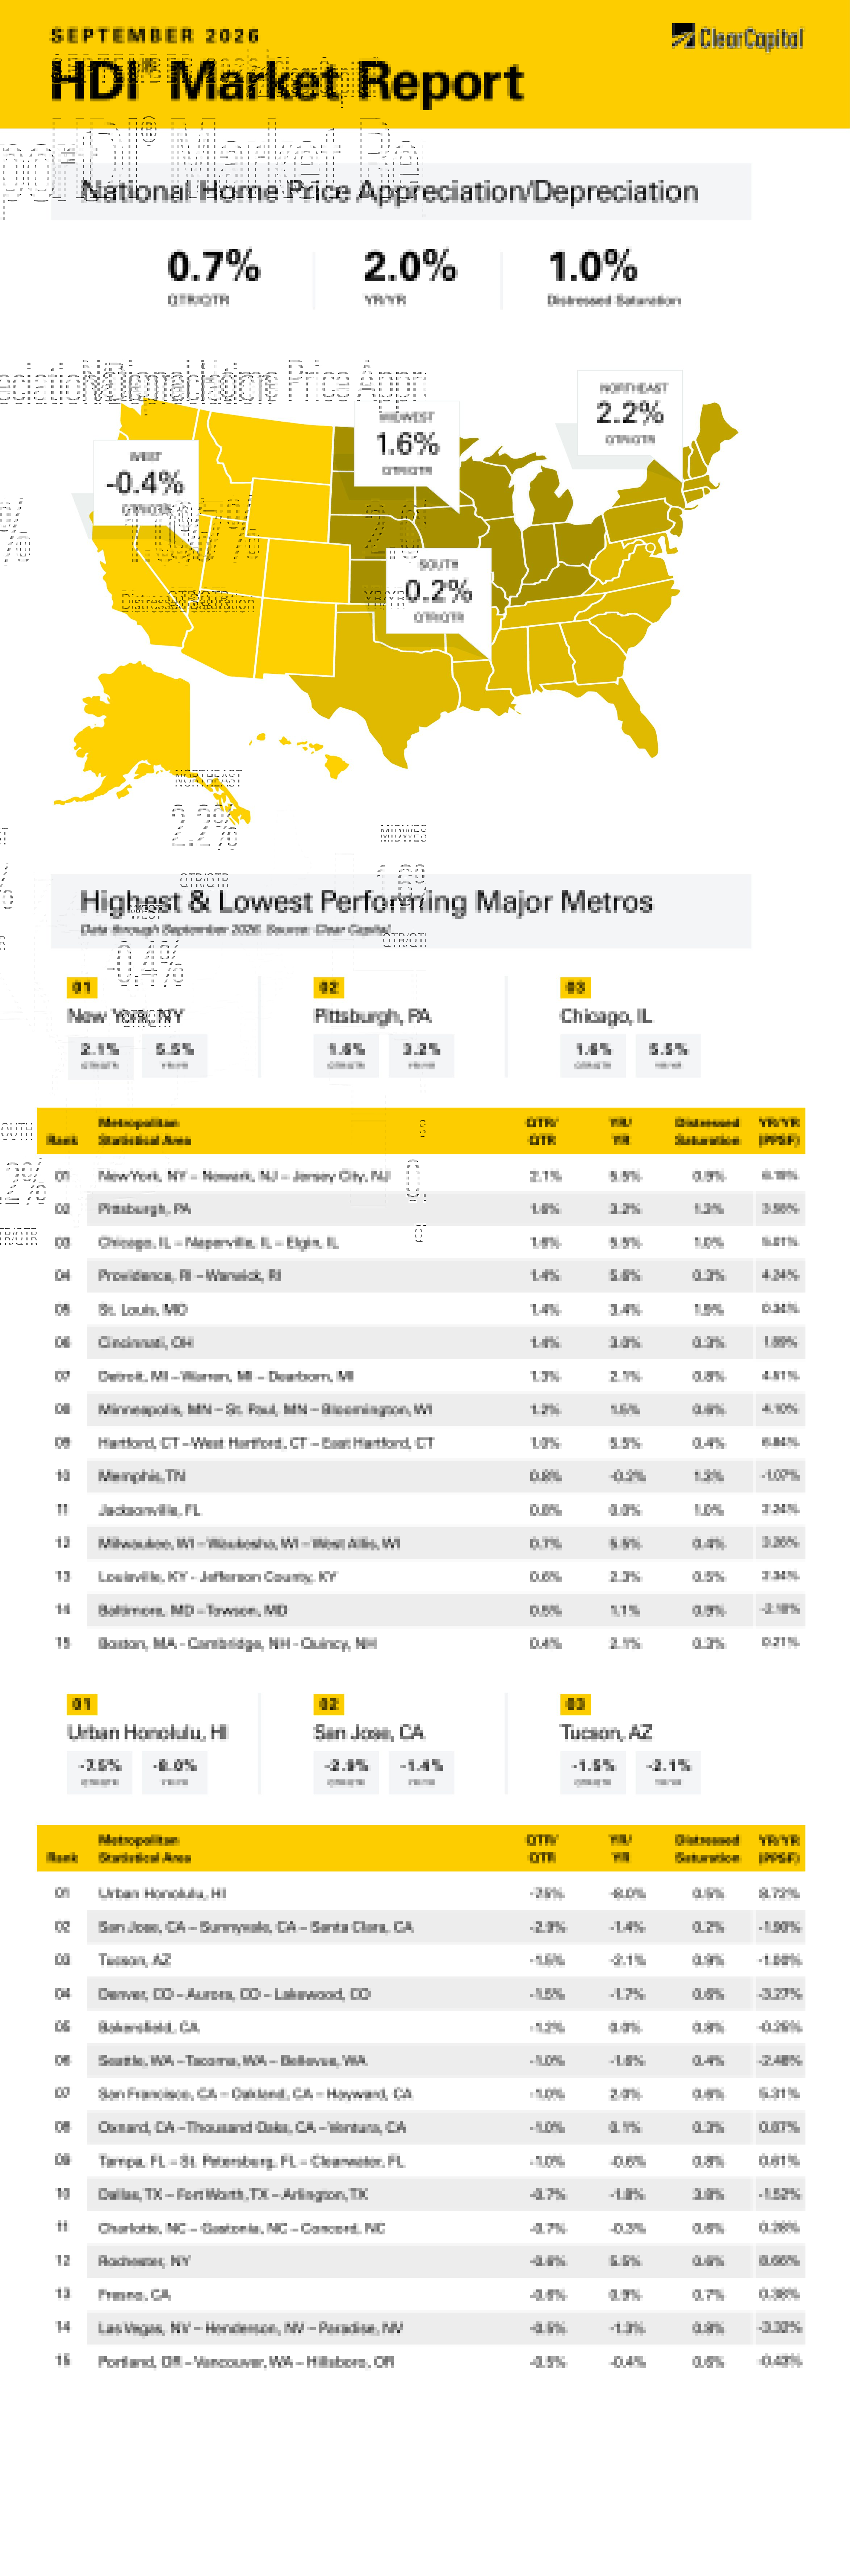
The September 2026 Clear Capital Home Data Index (HDI®) Market Report shows national quarter-over-quarter home price growth is at 0.7 percent.
Download the report, or read it below.
Commentary by Brent Nyitray of The Daily Tearsheet
Home price appreciation continued in September, according to the Clear Capital Home Data Index. Nationally, home prices rose 0.7% on a quarterly basis and 2.0% annually after rising 1.5% quarterly in August. Every region improved on an annual basis, but the West fell on a quarterly basis. It looks like the spike we saw in the early summer was in fact a blip and home price appreciation is decelerating again.
The Northeast took the top spot, with prices rising 2.2% quarterly and 5.0% annually. The top metropolitan statistical area (MSA) was again New York City, where prices rose 2.1% quarterly and 5.5% annually. Providence, RI was next, rising 1.4% quarterly and 5.6% annually. Hartford, CT rose 1.0% quarterly and 5.5% annually, while Pittsburgh, PA increased 1.6% quarterly and 3.2% annually.
The Midwest came in second, rising 1.6% quarterly and 3.7% annually. The top Midwestern MSA was Chicago, IL where prices grew 1.6% quarterly and 5.5% annually. St. Louis, MO saw prices rise 1.4% quarterly and 3.4% annually. In Cincinnati, OH, prices rose 1.4% on a quarterly basis and 3.0% annually.
The South came in third, where prices rose 0.2% on a quarterly basis and rose 0.7% on an annual basis. Jacksonville, FL was the leader where prices rose 0.8% on a quarterly basis and were flat annually. Memphis, TN also made the top 15, rising 0.8% quarterly and falling 0.2% annually. The lowest performing Southern MSAs included Tampa, FL, where prices fell 1% quarterly and 0.6% annually and Charlotte, NC, where they dropped 0.7% quarterly and 0.3% annually.
The West came in last, where prices fell 0.4 on a quarterly basis and rose 0.1 annually. No Western MSAs landed in the top 15. Western MSAs accounted for 11 of the 15 lowest performing MSAs last month, with Honolulu, HI down 7.5% quarterly and 8.0% annually. In San Jose, CA, prices fell 2.9% quarterly and 1.4% annually. Other Western MSAs in the bottom 15 include Tucson, AZ; Oxnard, CA; Fresno, CA; Seattle, WA; and Denver, CO.
The story of the past month has been the dramatic increase in interest rates. The Fed raised the Fed Funds rate by a quarter of a percentage point at the September meeting, however long-term rates have increased by much more. The 10-year bond yield began September at 4.76% and ended the month at 5.29%, an increase of 53 basis points or just over one half of one percent. The 30-year fixed-rate mortgage began the month at 6.66% and began October at 7.28%.
There was no specific catalyst for the bond sell-off. Oil rose about 5% during the month, however it was much higher earlier this year and 13.5 million barrels per day are transiting the Strait of Hormuz, compared to 6 million just after hostilities began. The supply bottleneck in global oil markets is getting better, not worse. The inflation numbers for August didn’t change much from July, so it is hard to argue that inflation changes are the driver. Finally, this isn’t just a US phenomenon — all major sovereign yields rose during the month. The French OAT picked up 67 basis points in yield, while UK Gilts rose 28 basis points and German Bunds rose 25. It has been a bloodbath in global sovereign debt. Debt levels? Maybe. But global debt levels have been unsustainable for years and the country with the worst debt-to-GDP ratio (Japan) has the lowest rates in the world. Unfortunately, there simply isn’t a great reason why sentiment shifted so dramatically over the past year. It could simply be bear-market behavior.
The bond bull market that ended sometime in 2021 began way back in 1981, when Paul Volcker raised interest rates into the high teens to break the back of 1970s inflation. Back then, bond sentiment was so bad a borrower could earn 17.5% on a six-month CD and treasuries were derisively called “certificates of confiscation.” The previous bear market in bonds lasted half a century. Bond market cycles are long. Most investors have been conditioned to believe stocks go up over time and rates fall over time. Those days in the bond market appear to be over and perhaps this is simply the market coming to grips with that fact. People hoping for a return to 0% interest rates and 3% mortgages will probably have to wait until the early 22nd century.
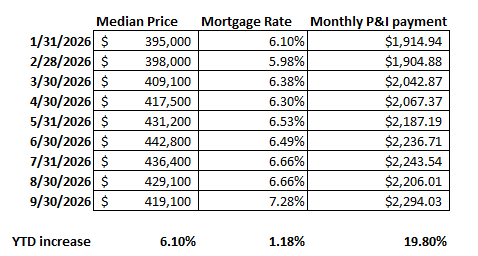
The increase in rates has caused the affordability problem to get much worse. Since the beginning of the year, the median home price has increased by 6% while the 30-year fixed-rate mortgage rate has risen from 6.1% to 7.28%. These changes have pushed the principal and interest payment on the median house from $1,915 to $2,294 or an increase of nearly 20%. The table below illustrates how much things have changed. Note the September median price is an estimate based on a 2% YOY increase from September 2025.
In addition to the problems for the typical homebuyer, the increase in rates comes at an inopportune time for professional real estate investors. The COVID years saw a tremendous boom in apartment building/refurbishing and many of these refurbishing projects were financed with five-year bridge loans which are now coming due. Average asking rents have been steady or falling for the past few years and many projects which were penciled out during the years of ultra-low interest rates no longer make sense. Expected rents aren’t high enough to cover the interest expense at current rates. These projects will require big equity injections to get refinanced. Some sponsors might choose to go the bankruptcy route especially in places which were overbuilt during the pandemic years. New apartments in overbuilt areas are offering up to three months free rent to entice tenants. None of this is good for multifamily real estate prices. The single-family market is less overbuilt, so it might escape some of the fallout. But higher rates will mean a powerful headwind for further home price appreciation.
About the Clear Capital Home Data Index (HDI®) Market Report and Forecast
The Clear Capital HDI Market Report and Forecast provides insights into market trends and other leading indices for the real estate market at the national and local levels. A critical difference in the value of Clear Capital’s HDI Market Report and Forecast is the capability to provide more timely and granular reporting than nearly any other home price index provider.
Clear Capital’s HDI Methodology
• Generates the timeliest indices in patent pending, rolling quarter intervals that compare the most recent four months to the previous three months. The rolling quarters have no fixed start date and can be used to generate indices as data flows in, significantly reducing multi-month lag time that may be experienced with other indices.
• Includes both fair market and institutional (real estate owned) transactions, giving equal weight to all market transactions and identifying price tiers at a market specific level. By giving equal weight to all transactions, the HDI is truly representative of each unique market.
• Results from an address-level cascade create an index with the most granular, statistically significant market area available.
• Provides weighted repeat sales and price-per-square-foot index models that use multiple sale types, including single-family homes, multi-family homes and condominiums.
The information contained in this report and forecast is based on sources that are deemed to be reliable; however, no representation or warranty is made as to the accuracy, completeness, or fitness for any particular purpose of any information contained herein. This report is not intended as investment advice, and should not be viewed as any guarantee of value, condition, or other attribute.