


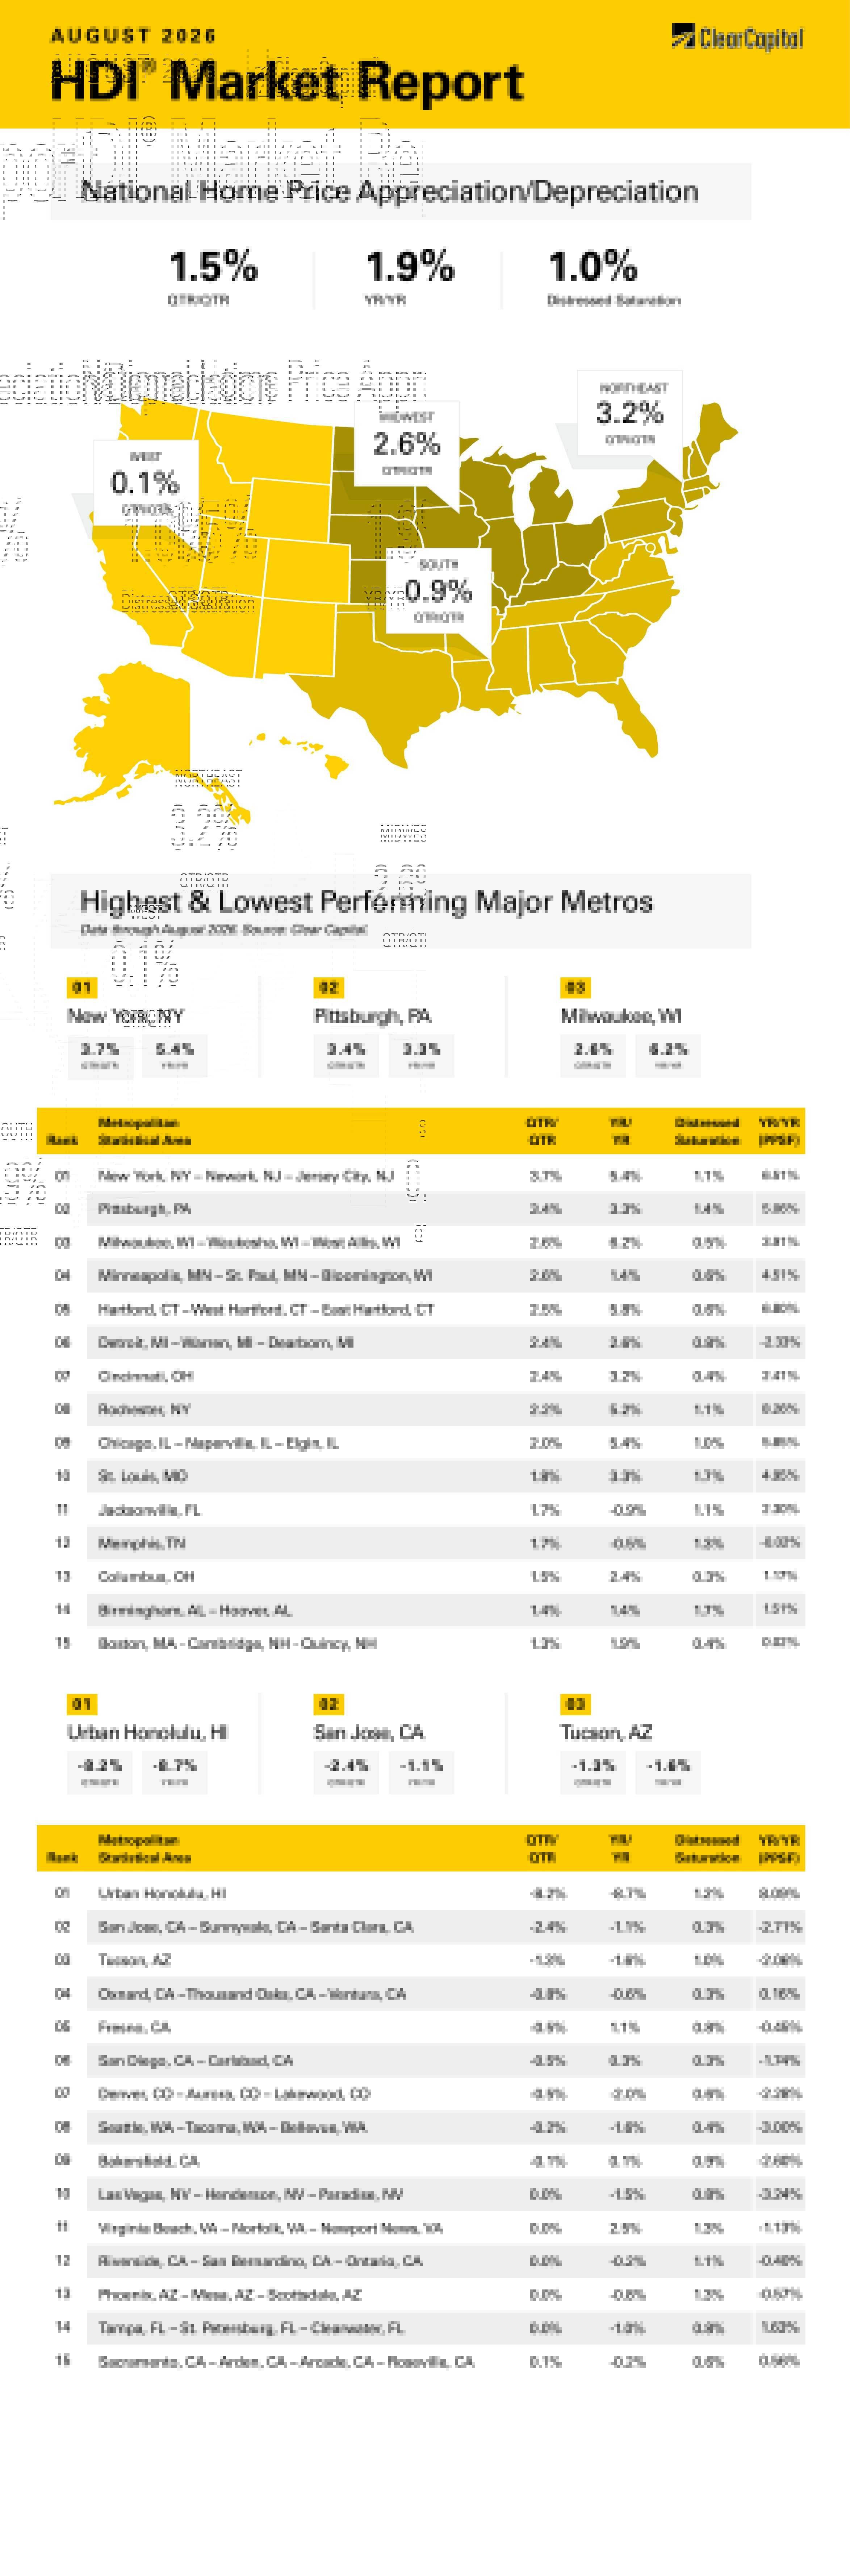
The August 2026 Clear Capital Home Data Index (HDI®) Market Report shows national quarter-over-quarter home price growth is at 1.5 percent.
Download the report, or read it below.
Commentary by Brent Nyitray of The Daily Tearsheet
Home price appreciation continued in August, according to the Clear Capital Home Data Index. Nationally, home prices rose 1.5% on a quarterly basis and 1.9% annually after rising 2.2% quarterly in July. Every region improved on a quarterly and annual basis. After a period of sub-par growth, home price appreciation is back, albeit at a modest pace.
The Northeast took the top spot, with prices rising 3.2% quarterly and 4.7% annually. The top metropolitan statistical area (MSA) was the New York City area where prices rose 3.7% quarterly and 5.4% annually. Hartford, CT was next, rising 2.5% quarterly and 5.8% annually. Rochester, NY rose 2.2% quarterly and 5.2% annually. For-sale inventory in the Northeast is extremely restricted as construction has focused on apartment buildings, not single-family residences.
The Midwest came in second, rising 2.6% quarterly and 3.8% annually. The top Midwestern MSA remained Milwaukee, WI, where prices grew 2.6% quarterly and 6.2% annually. Minneapolis, MN saw prices rise 2.6% quarterly and 1.4% annually. In Detroit, MI, prices rose 2.4% on a quarterly basis and 2.6% annually. Midwestern MSAs accounted for 7 of the top 15 MSAs.
The South came in third, where prices rose 0.9% on a quarterly basis and 0.6% on an annual basis. Jacksonville, FL was the leader where prices rose 1.7% on a quarterly basis but fell 0.9% annually. Florida MSAs had been overrepresented in the bottom 15 for several months but in August only one remained — Tampa, where prices were flat quarterly and down 1% annually. Birmingham, AL remained strong with prices rising 1.4% quarterly and annually.
The West came in last, where prices rose 0.1 on a quarterly basis and were flat annually. No Western MSAs landed in the top 15. Western MSAs accounted for 13 of the 15 lowest performing MSAs last month with Honolulu, HI down 8.2% quarterly and 8.7% annually. In San Jose, CA, prices fell 2.4% quarterly and 1.1% annually. Other Western MSAs in the bottom 15 include Tucson, AZ; Oxnard, CA; Fresno, CA; San Diego, CA; and Denver, CO.
For a while, I have been referring to the “hip-to-be-square” trade going on in residential real estate. The name is a reference to a Huey Lewis and the News song from the 1980s, but it refers to the fact that the regions which saw the biggest home price appreciation since the 2008 bust (the West and the South) are taking a backseat to ones that lagged (particularly the Northeast and the Midwest).
It turns out that building activity explains a lot of what is going on. I plotted the number of new homes for sale in the US and the four regions tracked by the Clear Capital Home Data Index. There are currently just under 500,000 homes for sale in the US. Sixty percent of these homes are in the South, and another 20% are in the West. The remaining 20% are split between the Midwest and the Northeast.
Population doesn’t explain the divergence. The South is roughly 40% of the US population and has 60% of the homes for sale. The Northeast has 17% of the US population and 7% of the new homes for sale.
Below is a chart of new homes for sale in the different regions and the US total since 2000:
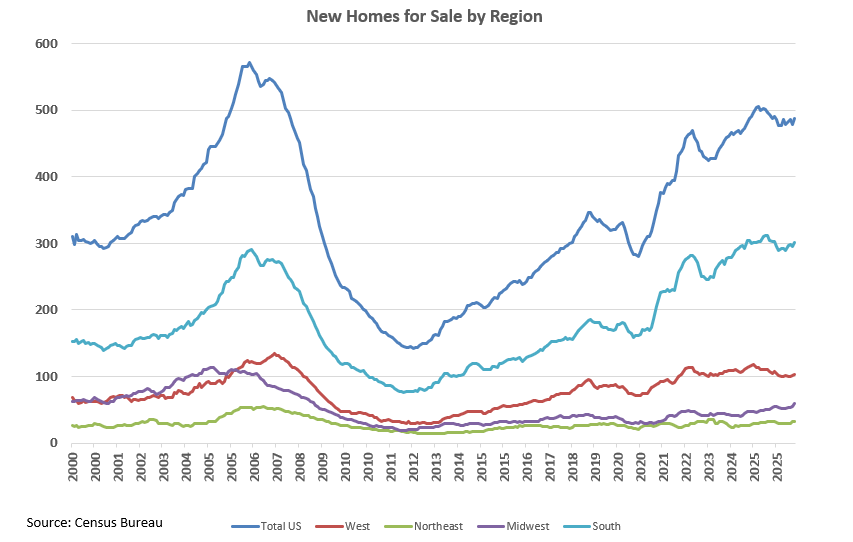
While housing advocates are pushing for more construction, it is clear from the chart that the problem isn’t the number of homes for sale. The top blue line represents the US in total, and we are close to the highs we saw during the residential real estate bubble. In fact, the South has more new homes for sale today than it did in 2006. The West’s building has been a story of people leaving expensive California MSAs for cheaper ones in the California interior and Arizona. These MSAs became overbuilt and builders are choking on inventory.
The issue isn’t supply per se — it is supply in the places where demand is strongest. The chattering classes are overrepresented in cities like Los Angeles, New York City and Washington, D.C. These areas are already dense, and additional supply has been tilted towards luxury apartments. Washington, D.C. has managed to build out into the exurbs, but affordability remains stretched. The New York City suburbs have seen very limited apartment construction, and most single-family construction activity is limited to improving existing homes. Demand for what few homes hit the market is fierce. LA will be restricted in its ability to grow out due to its insane traffic. The point is that housing advocates generally don’t live in places like Akron, OH where real estate is cheap and that colors their opinions.
Where is the building going on? If you look at investor mortgage activity, there is a lot of activity in inner cities once left for dead. Developers are bidding up rowhouses and vacant lots in Philadelphia and Baltimore. These are being turned into new apartment buildings. Cities like Chicago, Detroit, and Cleveland are seeing the same thing. Walkable, urban environments are still popular, and development is meeting the demand where it can. Call it the Rust Belt Renaissance. These places became too cheap to ignore.
The problem of housing affordability was due primarily to home price appreciation during the COVID years, driven by rock-bottom interest rates, quantitative easing, and a simple case of too much money chasing too few assets. It was not due to too little building; it was due to too little building in the most expensive MSAs. Housing advocates can tinker with yes-in-my-back-yard-ism, zoning changes and limiting red tape but ultimately they don’t have a silver bullet idea to make New York City affordable.
About the Clear Capital Home Data Index (HDI®) Market Report and Forecast
The Clear Capital HDI Market Report and Forecast provides insights into market trends and other leading indices for the real estate market at the national and local levels. A critical difference in the value of Clear Capital’s HDI Market Report and Forecast is the capability to provide more timely and granular reporting than nearly any other home price index provider.
Clear Capital’s HDI Methodology
• Generates the timeliest indices in patent pending, rolling quarter intervals that compare the most recent four months to the previous three months. The rolling quarters have no fixed start date and can be used to generate indices as data flows in, significantly reducing multi-month lag time that may be experienced with other indices.
• Includes both fair market and institutional (real estate owned) transactions, giving equal weight to all market transactions and identifying price tiers at a market specific level. By giving equal weight to all transactions, the HDI is truly representative of each unique market.
• Results from an address-level cascade create an index with the most granular, statistically significant market area available.
• Provides weighted repeat sales and price-per-square-foot index models that use multiple sale types, including single-family homes, multi-family homes and condominiums.
The information contained in this report and forecast is based on sources that are deemed to be reliable; however, no representation or warranty is made as to the accuracy, completeness, or fitness for any particular purpose of any information contained herein. This report is not intended as investment advice, and should not be viewed as any guarantee of value, condition, or other attribute.