

The May 2025 Clear Capital Home Data Index (HDI®) Market Report shows national quarter-over-quarter home price growth is at 1.4 percent.
Download the report, or read it below.
Commentary by Brent Nyitray of The Daily Tearsheet
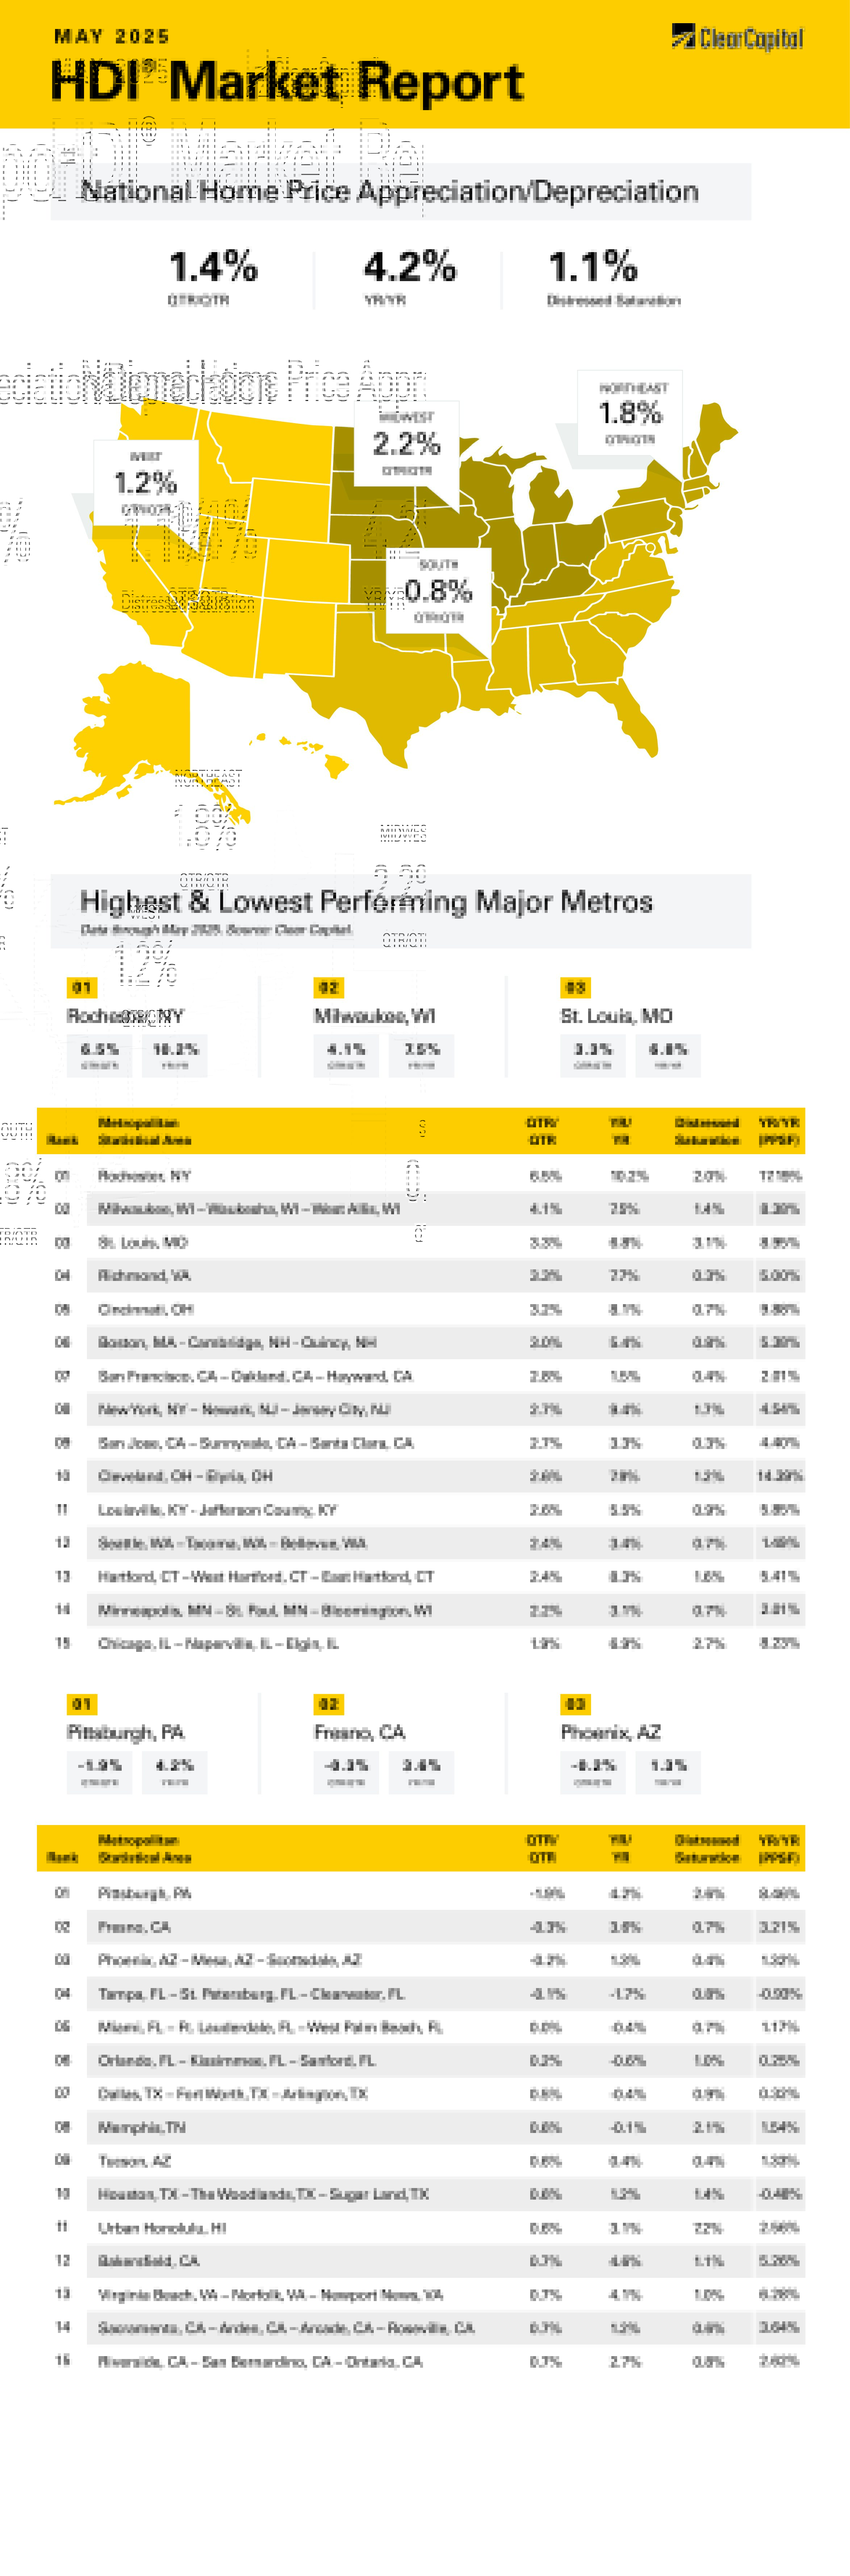
Home prices rose 1.4% quarter-over-quarter (QoQ) in May, according to the Clear Capital Home Data Index. On a year-over-year (YoY) basis, prices rose 4.2%. All regions rose on a YoY basis and a QoQ basis.
The Northeast performed the best on a YoY basis, increasing 1.8% QoQ and 7.3% YoY. The top Northeastern MSA was Rochester, NY where prices rose 6.5% QoQ and 10.2% YoY. Hartford, CT rose 2.4% QoQ and 8.3% YoY, while the New York City Metropolitan area rose 2.7% QoQ and 9.4% YoY.
The Midwest was the next-best performing region on a YoY basis, where prices rose 2.2% QoQ and 6.0% YoY. Cincinnati, OH was the top Midwestern MSA where prices rose 3.2% QoQ and 8.1% YoY. Milwaukee was next at 4.1% QoQ and 7.5% YoY. Chicago was also a standout with prices rising 1.9% QoQ and 6.9% YoY.
The West was the third-best performing region, where prices rose 1.2% QoQ and 2.8% YoY. The best performing MSA was Seattle, where prices rose 2.4% QoQ and 3.4% YoY. San Jose was the next best performer where prices rose 2.7% QoQ and 3.3% YoY. San Francisco was also strong, with prices rising 2.8% QoQ and 1.5% YoY. The worst Western MSA was Fresno, CA where prices fell 0.3% QoQ and increased 3.6% YoY.
The South was the worst-performing MSA. Prices rose 0.8% QoQ and 2.1% YoY. Richmond, VA was the top performer in the South, where prices rose 3.3% QoQ and 7.7% YoY. Louisville, KY was the next best area, where prices rose 2.6% QoQ and 5.5% YoY. The worst-performing MSA was Tampa, FL where prices fell 0.1% QoQ and 1.7% YoY. Miami also struggled, where prices were flat QoQ and fell 0.4% YoY.
The post-COVID era had a couple of major themes, which are beginning to unwind. The first was a focus on apartment construction and the second involved migration patterns. These two themes have implications for real estate prices.
From 2022 through 2024, the US experienced a boom in multi-family construction spending. The post-pandemic jump in multi-family construction was truly historic. In 2024, over 600,000 new units hit the market, which represented a 65% increase from 2022 — the biggest percentage jump since the mid-1980s.
The jump in construction made sense: Median rents rose about 25% from the beginning of 2021 to mid-2022. A 25% increase in median rent over 18 months doesn’t happen very often and it unsurprisingly kicked off the biggest jump in inflation since the early 1980s.
After peaking in 2022, apartment rents have exhibited their normal seasonality, but the overall trendline has been down according to data from Apartments.com.
In the chart below, you can see how — despite rents peaking in mid-2022 — multifamily units under construction didn’t peak until a year later.
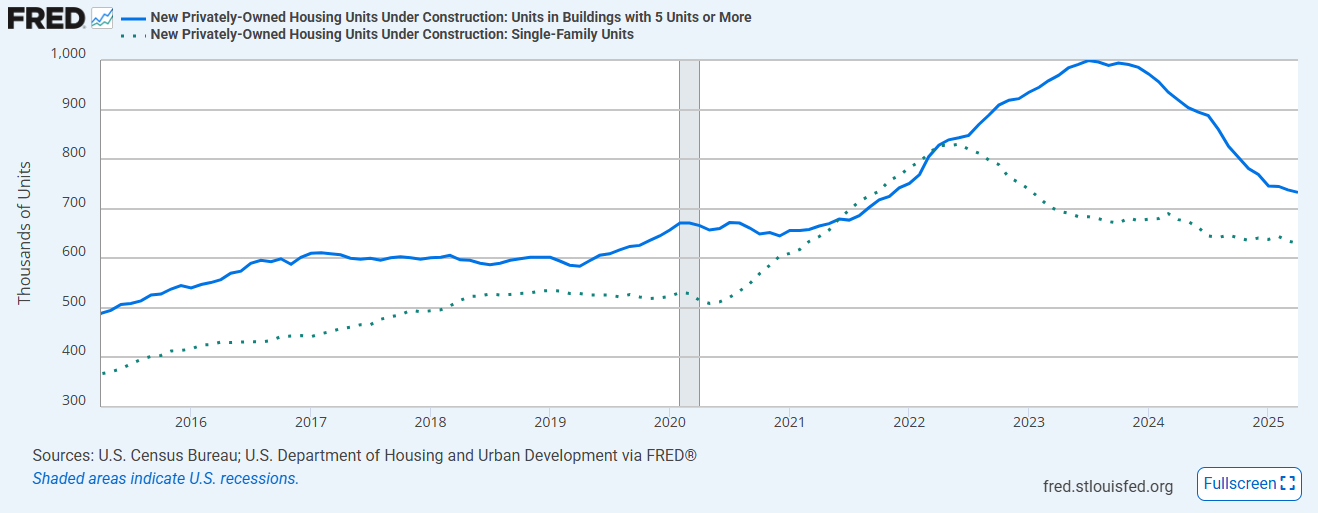
We are now seeing the tide roll out. The latest Census Department Construction Spending Report showed that the value of multi-family construction spending fell 11.3% over the past year, while single-family construction fell 2.2%.
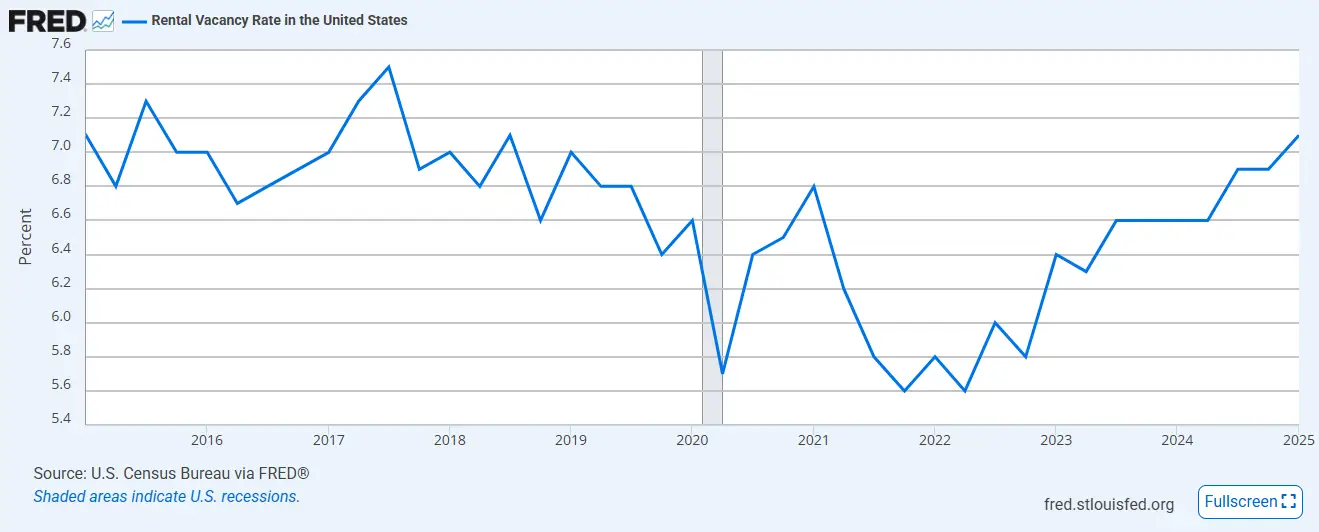
The increase in apartment supply pushed up the vacancy rate to 7.1% in the first quarter of 2025 according to Census Bureau data. This is the highest rate since the third quarter of 2018. Even though units under construction are lower than in 2024, they are still well above pre-pandemic levels which means the glut should continue.
Much of the muti-family construction was in the South — particularly in Florida, Texas, and Arizona — as homebuyers fled urban areas during the pandemic. We are now seeing apartment demand slow as immigration declines and affordability issues arise. This portends weaker pricing in these MSAs.
The out-of-favor regions after the financial crisis (the Midwest and the Northeast) are seeing buyers return as the Midwest remains cheap and the South and West become more expensive relative to the Northeast. Insurance costs are adding to the pressure. Whatever affordability advantage that existed in the Southern US five years ago has largely evaporated.
Another tailwind for the Northeast is the current budget which raises the state and local tax deduction to $40,000 from $10,000. This vastly improves the affordability of homes in high-tax states like New York, New Jersey, and Massachusetts.
These developments have implications for monetary policy and interest rates. The combination of burgeoning supply, rising vacancies and flat rents should contribute to shelter disinflation going forward. This should help offset at least some tariff-driven inflation especially since shelter is such a major component of household expenses and carries a lot of weight in the indices.
Fed speakers like Austan Goolsbee and Neel Kashkari have been insisting it is too early to cut rates due to the potential inflationary impact of tariffs. The June meeting will have a fresh set of economic forecasts, and we should expect to see the Fed increase their estimate for PCE inflation and decrease growth estimates. That said, the most interesting number will be the estimate for the long-term Fed Funds rate. The long-term Fed Funds rate is the FOMC’s best guess for the neutral rate of policy. Historically it has been in the low 3% range, which means the Fed is still moderately tight. Unless we see a spike in tariff-driven inflation, the Fed will run out of excuses to keep policy tight by the fall.
A combination of falling rates and migration means that we might see a robust purchase market towards the end of 2025 and into 2026.
About the Clear Capital Home Data Index (HDI®) Market Report and Forecast
The Clear Capital HDI Market Report and Forecast provides insights into market trends and other leading indices for the real estate market at the national and local levels. A critical difference in the value of Clear Capital’s HDI Market Report and Forecast is the capability to provide more timely and granular reporting than nearly any other home price index provider.
Clear Capital’s HDI Methodology
• Generates the timeliest indices in patent pending, rolling quarter intervals that compare the most recent four months to the previous three months. The rolling quarters have no fixed start date and can be used to generate indices as data flows in, significantly reducing multi-month lag time that may be experienced with other indices.
• Includes both fair market and institutional (real estate owned) transactions, giving equal weight to all market transactions and identifying price tiers at a market specific level. By giving equal weight to all transactions, the HDI is truly representative of each unique market.
• Results from an address-level cascade create an index with the most granular, statistically significant market area available.
• Provides weighted repeat sales and price-per-square-foot index models that use multiple sale types, including single-family homes, multi-family homes and condominiums.
The information contained in this report and forecast is based on sources that are deemed to be reliable; however, no representation or warranty is made as to the accuracy, completeness, or fitness for any particular purpose of any information contained herein. This report is not intended as investment advice, and should not be viewed as any guarantee of value, condition, or other attribute.