

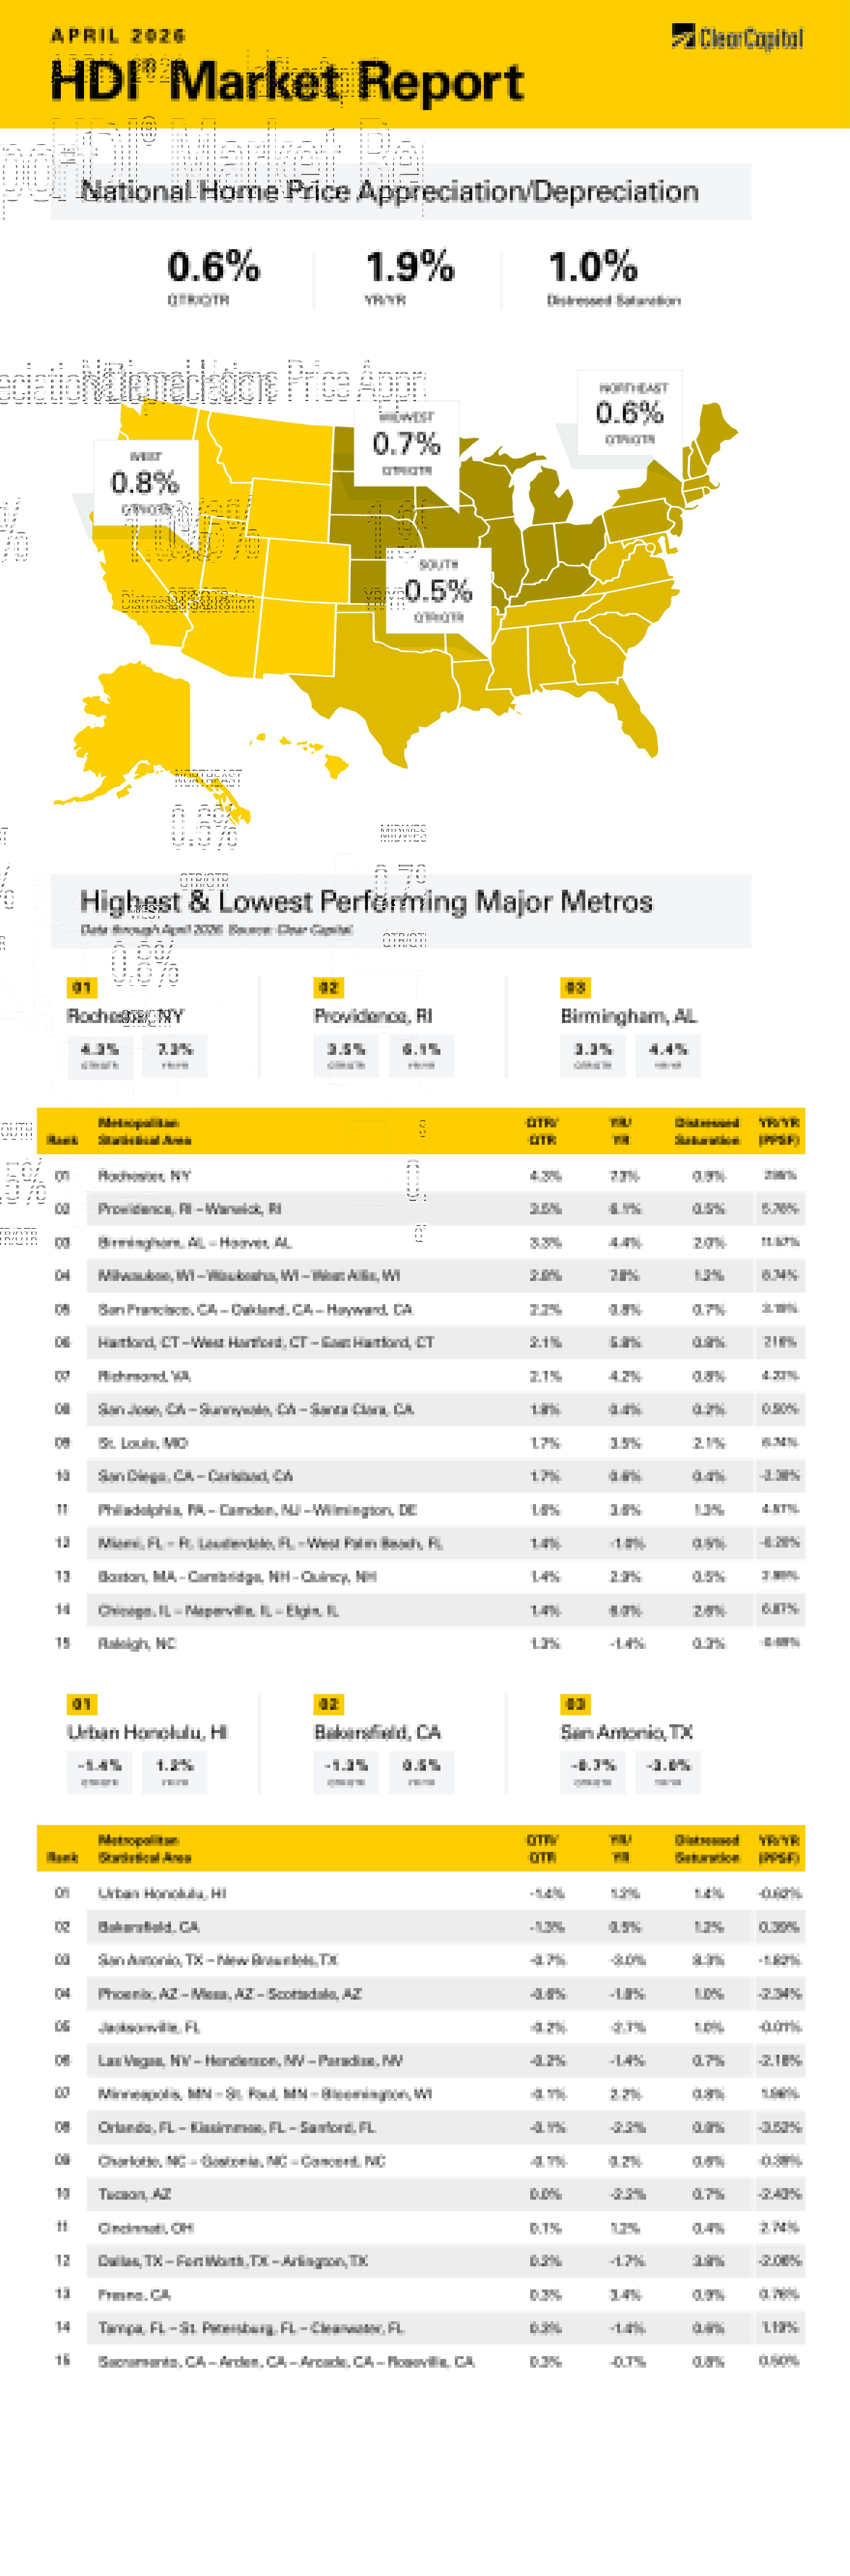
The April 2026 Clear Capital Home Data Index (HDI®) Market Report shows national quarter-over-quarter home price growth is at 0.6 percent.
Download the report, or read it below.
Commentary by Brent Nyitray of The Daily Tearsheet
Home price appreciation rebounded in April, according to the Clear Capital Home Data Index. Nationally, home prices rose 0.6% on a quarterly basis and 1.9% annually after falling 0.1% quarterly in March. Every region rose on a quarterly basis, and only one was negative on an annual basis.
The Northeast remained the top market, rising 0.6% quarterly and 4.9% annually. The top Northeastern Metropolitan Statistical Area (MSA) was Rochester, NY, where prices grew 4.3% on a quarterly basis and 7.3% annually. Providence, RI, was also a leader, rising 3.5% on a quarterly basis and 6.1% annually. In Hartford, CT, prices rose 2.1% on a quarterly basis and 5.8% annually. Philly was also strong, with prices rising 1.6% quarterly and 3.6% annually.
The Midwest was the next-best performer, with prices rising 0.7% quarterly and 4.1% annually. Milwaukee, WI showed impressive growth, rising 2.8% quarterly and 7.8% annually. In Chicago, prices rose 1.4% quarterly and 6.0% annually. The weakest Midwestern MSA was Minneapolis, MN, where prices fell 0.1% on a quarterly basis but rose 2.2% annually.
The South came in third, where prices rose 0.5% on a quarterly basis and rose 0.2% on an annual basis. Birmingham, AL, was the leader where prices rose 3.3% on a quarterly basis and 4.4% annually. Richmond, VA was in the top 15, where prices rose 2.1% on a quarter-over-quarter (QoQ) basis and 4.2% annually. Miami continued its rebound with prices rising 1.4% quarterly. San Antonio, TX was the worst Southern MSA, with prices falling 0.7% quarterly and 3.0% annually. Jacksonville, FL was also in the bottom 5.
The West came in last, where prices rose 0.8 on a quarterly basis but fell 0.1% annually. The top Western MSA was San Francisco, where prices rose 2.2% quarterly and 0.8% annually. San Jose, CA was also in the top 15, with prices increasing 1.8% quarterly and 0.4% annually. The worst quarterly performing MSA was Bakersfield, CA where prices fell 1.3% on a quarterly basis and rose 0.5% on an annual basis. Phoenix, AZ saw prices fall 0.6% quarterly and 1.8% on a year-over-year (YoY) basis.
Despite a rebound in real estate prices this month, the overall trend of home price appreciation has been down. Home prices are stretched relative to incomes, and mortgage rates are not coming down to provide relief. The homebuilders announced earnings recently, and many of them spoke of the K-shaped market, where the market for the top is going in one direction (upward) while the market for the bottom is going the other way (lower).
One well-known builder discussed this explicitly, talking about how the move-up and active adult communities are doing well, but starter homes continue to be an issue. Almost all of the homebuilders reported lower gross margins, which is indicative of price cuts. The bigger builders that have an origination arm are offering below-market mortgage rates as an incentive, which lowers the monthly payment while keeping the price unchanged and “maintaining the comps.” This builder did note that buyer traffic was “strong” and this Spring Selling Season is starting out well.
Another major builder said it was experiencing strong order growth. However, it expected sales incentives (read: price cuts) to remain elevated this year. Interestingly, the company noted that construction materials costs (sticks and bricks) are falling, so whatever big tariff fears were out there, they haven’t shown up in margins. This builder also mentioned that the labor shortage seems to be abating. Construction labor is now “consistent and plentiful.” It seems like more high school grads are skipping college and going into the trades.
The bottom line is that the builders have excess inventory and are cutting prices to move the merchandise. Real (i.e. inflation-adjusted) home prices continue to fall as home price appreciation has been lower than the inflation rate. As long as wages continue to rise faster than home price inflation, affordability will continue to move in the right direction.
In the chart below, you can see that the number of new homes for sale is back at the levels we saw during the housing bubble. Despite the narrative of a shortage, you aren’t seeing it in the numbers.
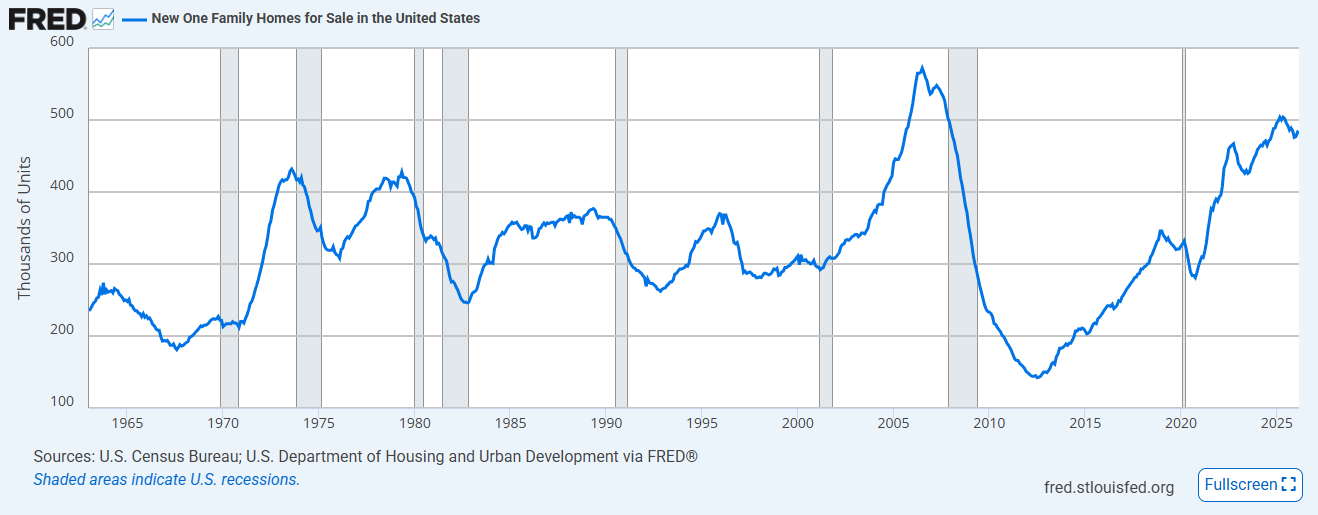
Existing homes for sale are elevated as well, and buyers have the upper hand for the first time in years.
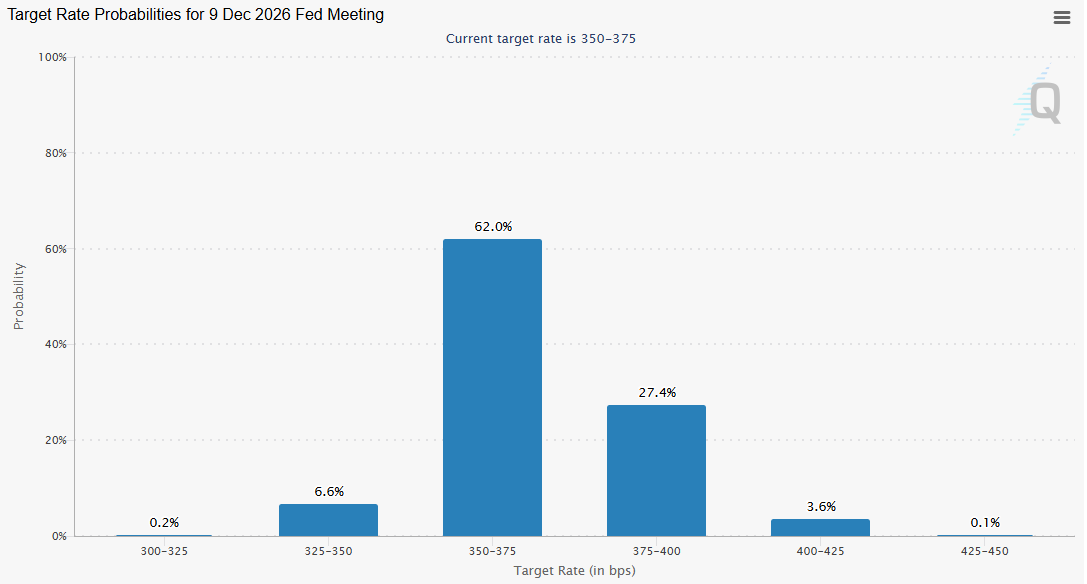
As expected, the Fed made no changes to policy at its meeting last week. Three governors (Beth M. Hammack, Neel Kashkari, and Lorie K. Logan) dissented, saying that they “supported maintaining the target range for the federal funds rate but did not support inclusion of an easing bias in the statement at this time.” This was unusual. It is interesting because the statement itself contains no references to bias. Neel Kashkari explained his position in a post on the Minneapolis Fed site. His point was that the market is assuming the next move out of the Fed is a cut, since that has been the narrative for the past two years. He wanted to stress that the Fed may consider increasing the Fed Funds rate, in hopes that this statement would tighten credit slightly now to avoid more drastic moves later. The Fed Funds futures took this to heart, and the December futures are now handicapping a 31% chance for a hike by the end of the year and only a 7% chance of a cut.
That said, there should be relief on the horizon. The temporary tariffs put in place after the Supreme Court decision will expire in mid June. That should have an immediate positive impact on inflation. The situation in the Persian Gulf doesn’t appear to be ending quickly. However, high prices encourage more production elsewhere as wells that were non-economic at $60 a barrel become profitable at $100 a barrel. Regardless of how long the situation in Iran lasts, inflation is probably going lower, especially since wage inflation seems to be behaving.
Ultimately, until oil prices fall the Fed is going to hold off on any further rate cuts, which won’t do much to help home price appreciation.
About the Clear Capital Home Data Index (HDI®) Market Report and Forecast
The Clear Capital HDI Market Report and Forecast provides insights into market trends and other leading indices for the real estate market at the national and local levels. A critical difference in the value of Clear Capital’s HDI Market Report and Forecast is the capability to provide more timely and granular reporting than nearly any other home price index provider.
Clear Capital’s HDI Methodology
• Generates the timeliest indices in patent pending, rolling quarter intervals that compare the most recent four months to the previous three months. The rolling quarters have no fixed start date and can be used to generate indices as data flows in, significantly reducing multi-month lag time that may be experienced with other indices.
• Includes both fair market and institutional (real estate owned) transactions, giving equal weight to all market transactions and identifying price tiers at a market specific level. By giving equal weight to all transactions, the HDI is truly representative of each unique market.
• Results from an address-level cascade create an index with the most granular, statistically significant market area available.
• Provides weighted repeat sales and price-per-square-foot index models that use multiple sale types, including single-family homes, multi-family homes and condominiums.
The information contained in this report and forecast is based on sources that are deemed to be reliable; however, no representation or warranty is made as to the accuracy, completeness, or fitness for any particular purpose of any information contained herein. This report is not intended as investment advice, and should not be viewed as any guarantee of value, condition, or other attribute.