

The May 2022 Home Data Index™ (HDI™) Market Report shows national quarter-over-quarter (QoQ) home price growth is at 8.9 percent.
Download the report, or read it below.
Commentary by Brent Nyitray of The Daily Tearsheet
Home price appreciation accelerated in May as the Clear Capital Home Data Index rose 8.9% quarter-over-quarter (QoQ) and 21.9% on a year-over-year (YoY) basis. This was a pickup from the April pace of 6% QoQ. Every region reported home price appreciation, and some of the hottest markets on the West Coast are accelerating again.
The fastest growing region was the West, which grew 23.8% last month. Phoenix was the leader, with prices rising 38%. Other notable Western metropolitan statistical areas (MSAs) include Seattle, where prices rose 25% and San Jose, where they rose 22%.
The South came in second at 23.7%, with the usual suspects showing the most growth. The leader was Tampa, where price rose 40% and Raleigh where prices rose 39%. Orlando saw a 33% increase in home prices.
The Northeast came in next, where prices rose 20.8% on a YoY basis. The Northeast did exhibit the largest quarterly increase, of 10.3%. No Northeast MSAs made it into the top 15, however some of the laggards were there, including New York City (up 16%) and Boston (up 16%).
Finally, the Midwest saw a 16.1% increase in prices. No Midwestern MSAs made the top 15. Other notable Midwestern MSAs include Chicago area, where prices rose 13.6% and Detroit where they rose 15.5%
April’s new home sales number was downright putrid. Sales of new homes fell to a seasonally adjusted annual pace of 591,000. This is down 17% from March and a full 27% compared to a year ago. New home sales are back at where they were in the early days of COVID and are about the average we saw from 1970 – 1985. Given the abject shortage of housing and rapidly rising prices, you would think that builders would be building new construction hand-over-fist.
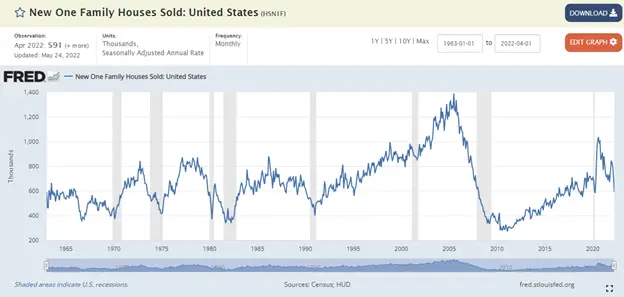
One thing to keep in mind is that new home sales estimate is often revised significantly in later months. That 591,000 number is a first pass estimate, and the standard of error is big. Regardless of this particular number, the housing shortage is well-known, and housing starts remain depressed compared to the demand out there. So, what is going on? The short answer: costs.
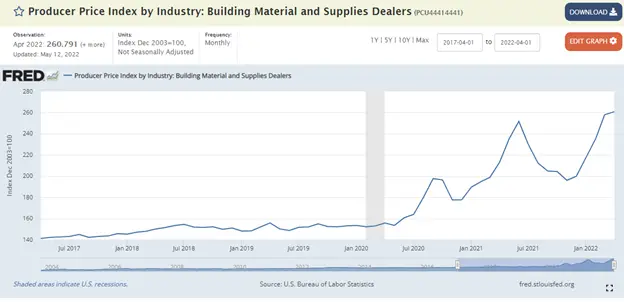
One of the first places to look is building materials. And while lumber gets most of the attention, it isn’t the only input to housing. The Producer Price Index for building materials and services has risen 70% since the beginning of the pandemic.
Labor is another critical issue for the homebuilding industry. The shortage of skilled labor is acute, as anyone who has tried to get an electrician or plumber to work on something at their house knows. At the peak of the real estate boom, there were over a million employees working in residential building. That number fell to 570,000 in the aftermath of the bust; however, it has rebounded to about 900,000.
The National Association of Homebuilders / Wells Fargo Builder Sentiment Survey has cooled off dramatically since the end of 2021. Builders were ebullient about their prospects last year, but one big component has fallen off a cliff: buyer traffic. So, is demand beginning to fall due to affordability concerns?
The average sales price of a new home in April was $570,300 which was a 31% increase from a year ago. The median sales price rose 20% to $450,600. This seems to suggest that builders are focusing more on the luxury market, where affordability is less of a concern. The issues facing the first-time homebuyer – low inventory and rising rates may have finally hit the breaking point.
So, what does this mean for house prices? If affordability is an issue, then the obvious solution would be that price are too high and need to come down. But that might not be all that likely. The issue of building materials prices is due to supply chain bottlenecks which will eventually work themselves out. There is an old saying in the commodities market: the cure for high price is high prices. Eventually supply catches up with demand. Lumber has come down markedly in price, although it is still elevated compared to pre-pandemic numbers.
Mortgage rates have been on a tear since the beginning of the year, but the bond market seems to be stabilizing, and mortgage rates are coming back down.
Labor is probably the most difficult problem – there just aren’t enough skilled laborers. That said, as salaries rise in the sector, more people will be drawn to the business. Ultimately labor probably squares the affordability circle for younger buyers. Wages have lagged inflation however that is typical – raises are generally handed out at the end of the year, and many people got substantial cost-of-living increases early this year. My sense is that the housing affordability issue will be solved with higher wages going forward, not lower housing prices.

About the Clear Capital Home Data Index™ (HDI™) Market Report and Forecast
The Clear Capital HDI Market Report and Forecast provides insights into market trends and other leading indices for the real estate market at the national and local levels. A critical difference in the value of Clear Capital’s HDI Market Report and Forecast is the capability to provide more timely and granular reporting than nearly any other home price index provider.
Clear Capital’s HDI Methodology
• Generates the timeliest indices in patent pending, rolling quarter intervals that compare the most recent four months to the previous three months. The rolling quarters have no fixed start date and can be used to generate indices as data flows in, significantly reducing multi-month lag time that may be experienced with other indices.
• Includes both fair market and institutional (real estate owned) transactions, giving equal weight to all market transactions and identifying price tiers at a market specific level. By giving equal weight to all transactions, the HDI is truly representative of each unique market.
• Results from an address-level cascade create an index with the most granular, statistically significant market area available.
• Provides weighted repeat sales and price-per-square-foot index models that use multiple sale types, including single-family homes, multi-family homes and condominiums.
The information contained in this report and forecast is based on sources that are deemed to be reliable; however, no representation or warranty is made as to the accuracy, completeness, or fitness for any particular purpose of any information contained herein. This report is not intended as investment advice, and should not be viewed as any guarantee of value, condition, or other attribute.