


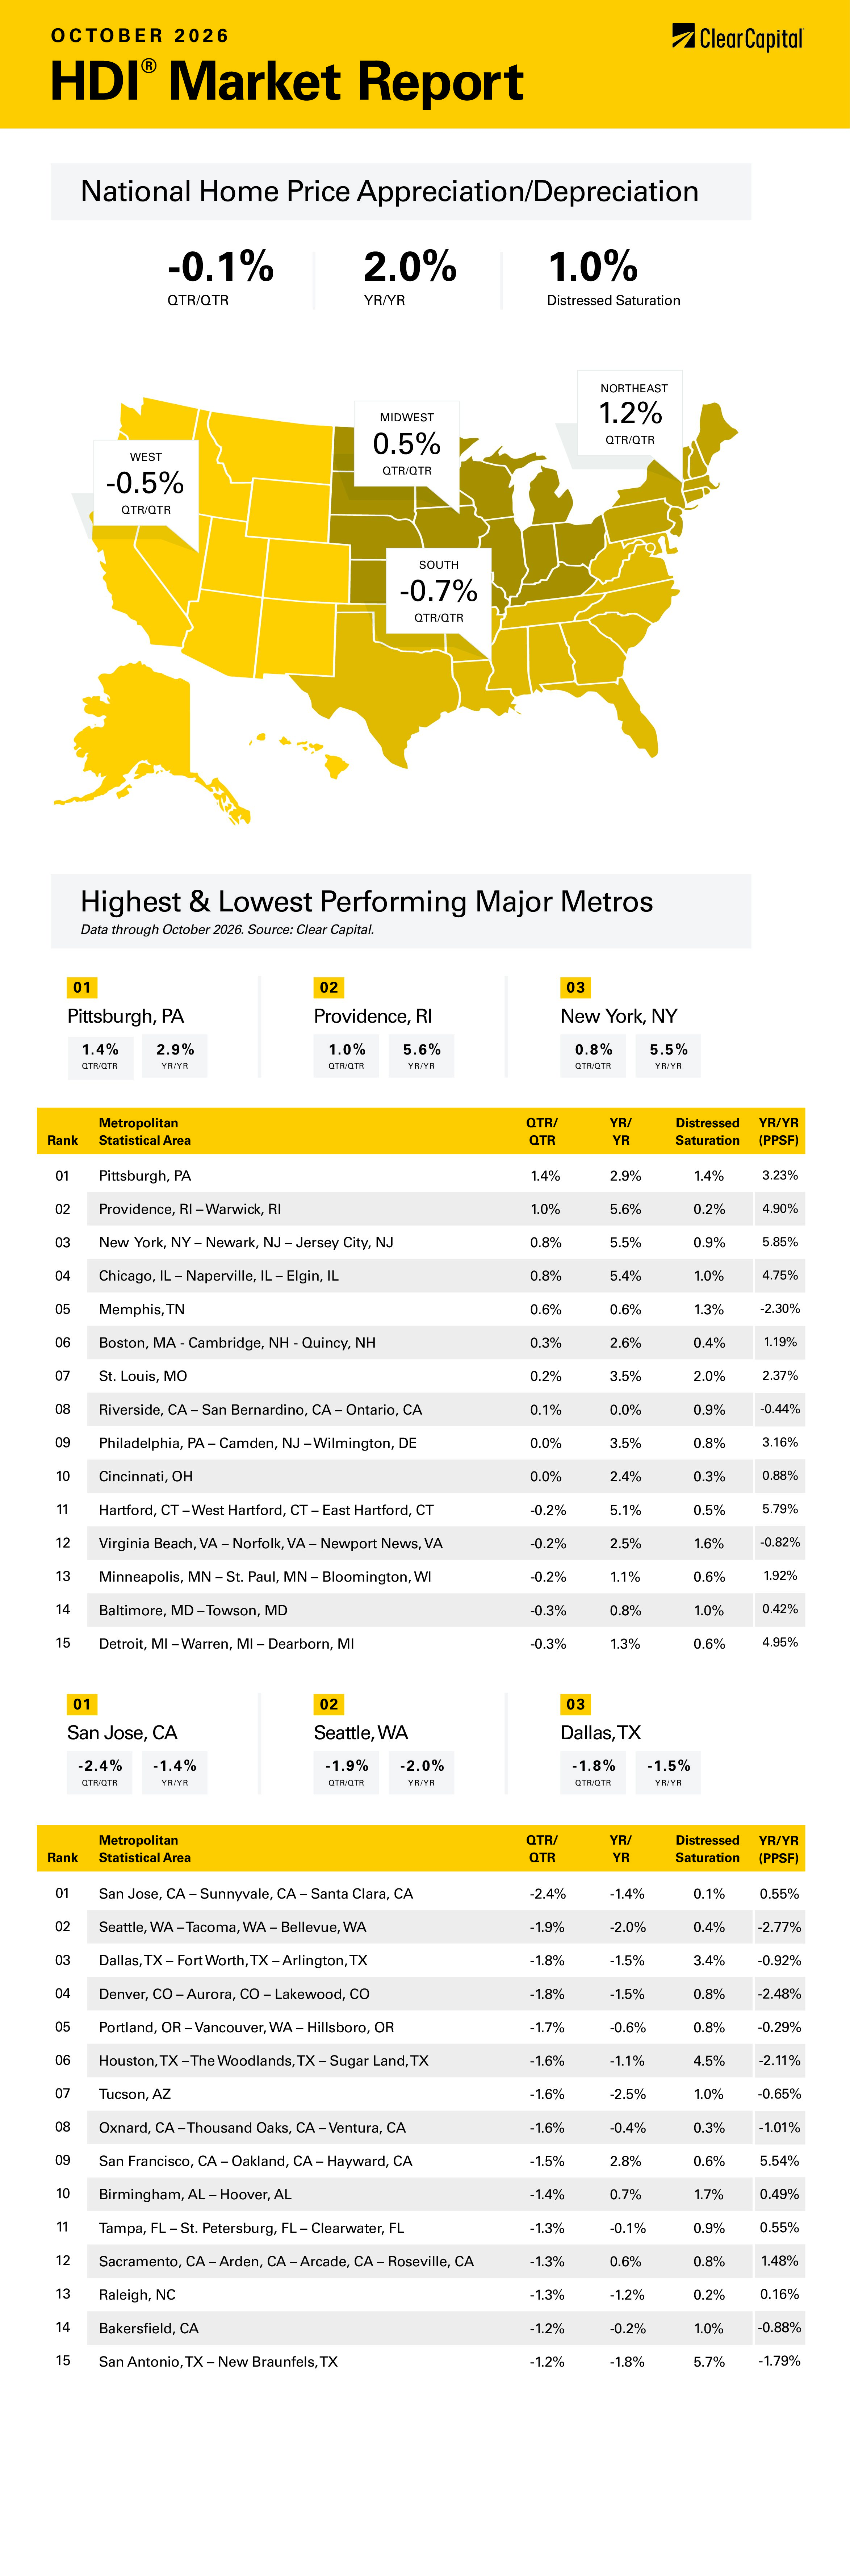
The October 2026 Clear Capital Home Data Index (HDI®) Market Report shows national quarter-over-quarter home price growth is at -0.1 percent.
Download the report, or read it below.
Commentary by Brent Nyitray of The Daily Tearsheet
Home price appreciation decelerated in October, according to the Clear Capital Home Data Index. Nationally, home prices fell 0.1% on a quarterly basis and rose 2.0% annually. Quarterly appreciation has decelerated dramatically, from 2.2% in July, to 1.5% in August, to 0.7% in September, to a 0.1% decrease in October. Every region saw increases on an annual basis, however the West fell on a quarterly basis. It looks like the spike we saw in the early summer was in fact a blip.
The Northeast took the top spot, with prices rising 1.2% quarterly and 4.9% annually. The top metropolitan statistical area (MSA) was Providence, RI, where prices rose 1.0% quarterly and 5.6% annually. New York City was next, rising 0.8% quarterly and 5.5% annually. Boston, MA rose 0.3% quarterly and 2.6% annually, while Pittsburgh, PA increased 1.4% quarterly and 2.9% annually.
The Midwest came in second, rising 0.5% quarterly and 3.5% annually. The top Midwestern MSA was Chicago, IL, where prices grew 0.8% quarterly and 5.4% annually. St. Louis, MO saw prices rise 0.2% quarterly and 3.5% annually. In Cincinnati, OH, prices were flat on a quarterly basis and up 2.4% annually.
The South came in third, where prices fell 0.7% on a quarterly basis and rose 0.6% on an annual basis. Memphis, TN was the leader, where prices rose 0.6% on a quarterly and annual basis. Virginia Beach, VA saw prices fall 0.2% on a quarterly basis but rose 2.5% annually. The lowest performing Southern MSAs was Dallas, TX, where prices fell 1.8% quarterly and 1.5% annually. In Houston, TX, prices dropped 1.6% quarterly and 1.1% annually.
The West came in last, where prices fell 0.5 on a quarterly basis and rose 0.3 annually. The only top Western MSA was Riverside, CA, where prices rose 0.1% quarter-over-quarter (QoQ) and were flat on an annual basis. Western MSAs accounted for 9 of the 15 lowest performing MSAs last month, with San Jose, CA down 2.4% quarterly and 1.4% annually. In Seattle, WA, prices fell 1.9% quarterly and 2.0% annually. Other Western MSAs in the bottom 15 include Tucson, AZ; Oxnard, CA; and Denver, CO.
Home price appreciation has stalled over the summer and fall with rising rates. The Clear Capital Home Data Index had already been decelerating when rates spiked in September and early October. The 10-year bond yield jumped over 50 basis points, hitting a high yield of 5.33%. Global sovereign debt markets saw a similar move, implying the jump was not simply US-specific. Surprisingly, interest rates have subsequently retraced nearly the entire increase. Since there wasn’t any identifiable catalyst for the big run up in rates, there doesn’t seem to be one for the reversal either. One possible explanation is that this was a big asset reallocation trade by macro investors.
One potential explanation for the subsequent decline is the risk-off trade. Increased signs of distress in data center and AI-related debt is making investors more cautious. Credit spreads (a measure of bond market distress) have been widening, which means that financing costs are rising. At a recent securitization conference, AI and data center debt was high on the list of concerns for market participants. The banks are full (in other words, they have as much exposure as they can handle) to this sector. There seems to be little interest from investors in buying some of that debt at current levels.
There are other clouds on the horizon. Recent earnings reports from many tech bellwethers including Alphabet, Amazon, and Intel have disappointed investors and the stocks have been punished severely. We are seeing increased layoffs in tech and finance. Microsoft just offered buyouts to 27% of its workforce. Kroger intends to cut 37% of its corporate office workforce over the next three years. AI is being blamed.
Unsurprisingly, the threat of AI-driven layoffs is getting the attention of voters. Data Centers are the most obvious target. Between political scrutiny and the increasing costs of financing them, construction will slow. In the advance estimate for Q3 GDP, investment contributed more to growth than consumption, which is 70% of the economy. That tailwind will decrease going forward. AI and data center-related debt is around half a trillion dollars, and any distress there will be felt outside of Wall Street.
What does this mean for the economy? Data center construction has been a big driver of commodity price inflation as they use a lot of steel, energy and building materials. A pause will help reduce commodity demand and pull the inflation numbers closer to the Fed’s 2% goal. Second, data centers have siphoned off a lot of construction workers who would otherwise be working in residential construction. Lower data center construction will help lower costs for homebuilders, who have been struggling between price pressures and high input costs.
A deceleration in data center construction will probably not cause a recession since consumer spending is still quite robust and we still have low unemployment. The caveat is whether issuers can service their debt. If a decline in construction triggers defaults, then a recession is possible. The Goldilocks scenario is that it decreases commodity demand enough to keep the Fed from hiking rates further. The current forecast is one more hike in 2026 and another in 2027.
Fannie Mae recently bumped its 2027 mortgage rate forecast from 6.7% to 7.5%. The September bond sell-off was probably the catalyst and Fannie was simply adjusting the forecast to the tape. Mortgage rates peaked at 7.4% in October and have since worked their way lower. A mortgage rate closer to 7% is probably the right call, and we shouldn’t see affordability get worse. If Fannie’s forecast is borne out, we would see a lousy year for home sales next year.
Homebuilder earnings for the third quarter were dismal, with most reporting decreasing revenues and margins. Builders are sitting on inventory and are unlikely to build any spec properties until the inventory is worked off. Until then, they are cutting prices to entice buyers.
Overall, we should expect modest growth in home prices for the foreseeable future. There aren’t any signs of distress in the mortgage-backed securities market which means a wholesale decline in prices isn’t in the cards. Neither is a jump in prices with interest rates at current levels. Home price affordability will improve gradually as appreciation lags inflation and incomes.
About the Clear Capital Home Data Index (HDI®) Market Report and Forecast
The Clear Capital HDI Market Report and Forecast provides insights into market trends and other leading indices for the real estate market at the national and local levels. A critical difference in the value of Clear Capital’s HDI Market Report and Forecast is the capability to provide more timely and granular reporting than nearly any other home price index provider.
Clear Capital’s HDI Methodology
• Generates the timeliest indices in patent pending, rolling quarter intervals that compare the most recent four months to the previous three months. The rolling quarters have no fixed start date and can be used to generate indices as data flows in, significantly reducing multi-month lag time that may be experienced with other indices.
• Includes both fair market and institutional (real estate owned) transactions, giving equal weight to all market transactions and identifying price tiers at a market specific level. By giving equal weight to all transactions, the HDI is truly representative of each unique market.
• Results from an address-level cascade create an index with the most granular, statistically significant market area available.
• Provides weighted repeat sales and price-per-square-foot index models that use multiple sale types, including single-family homes, multi-family homes and condominiums.
The information contained in this report and forecast is based on sources that are deemed to be reliable; however, no representation or warranty is made as to the accuracy, completeness, or fitness for any particular purpose of any information contained herein. This report is not intended as investment advice, and should not be viewed as any guarantee of value, condition, or other attribute.