

The February 2026 Clear Capital Home Data Index (HDI®) Market Report shows national quarter-over-quarter home price growth is at -0.5 percent.
Download the report, or read it below.
Commentary by Brent Nyitray of The Daily Tearsheet
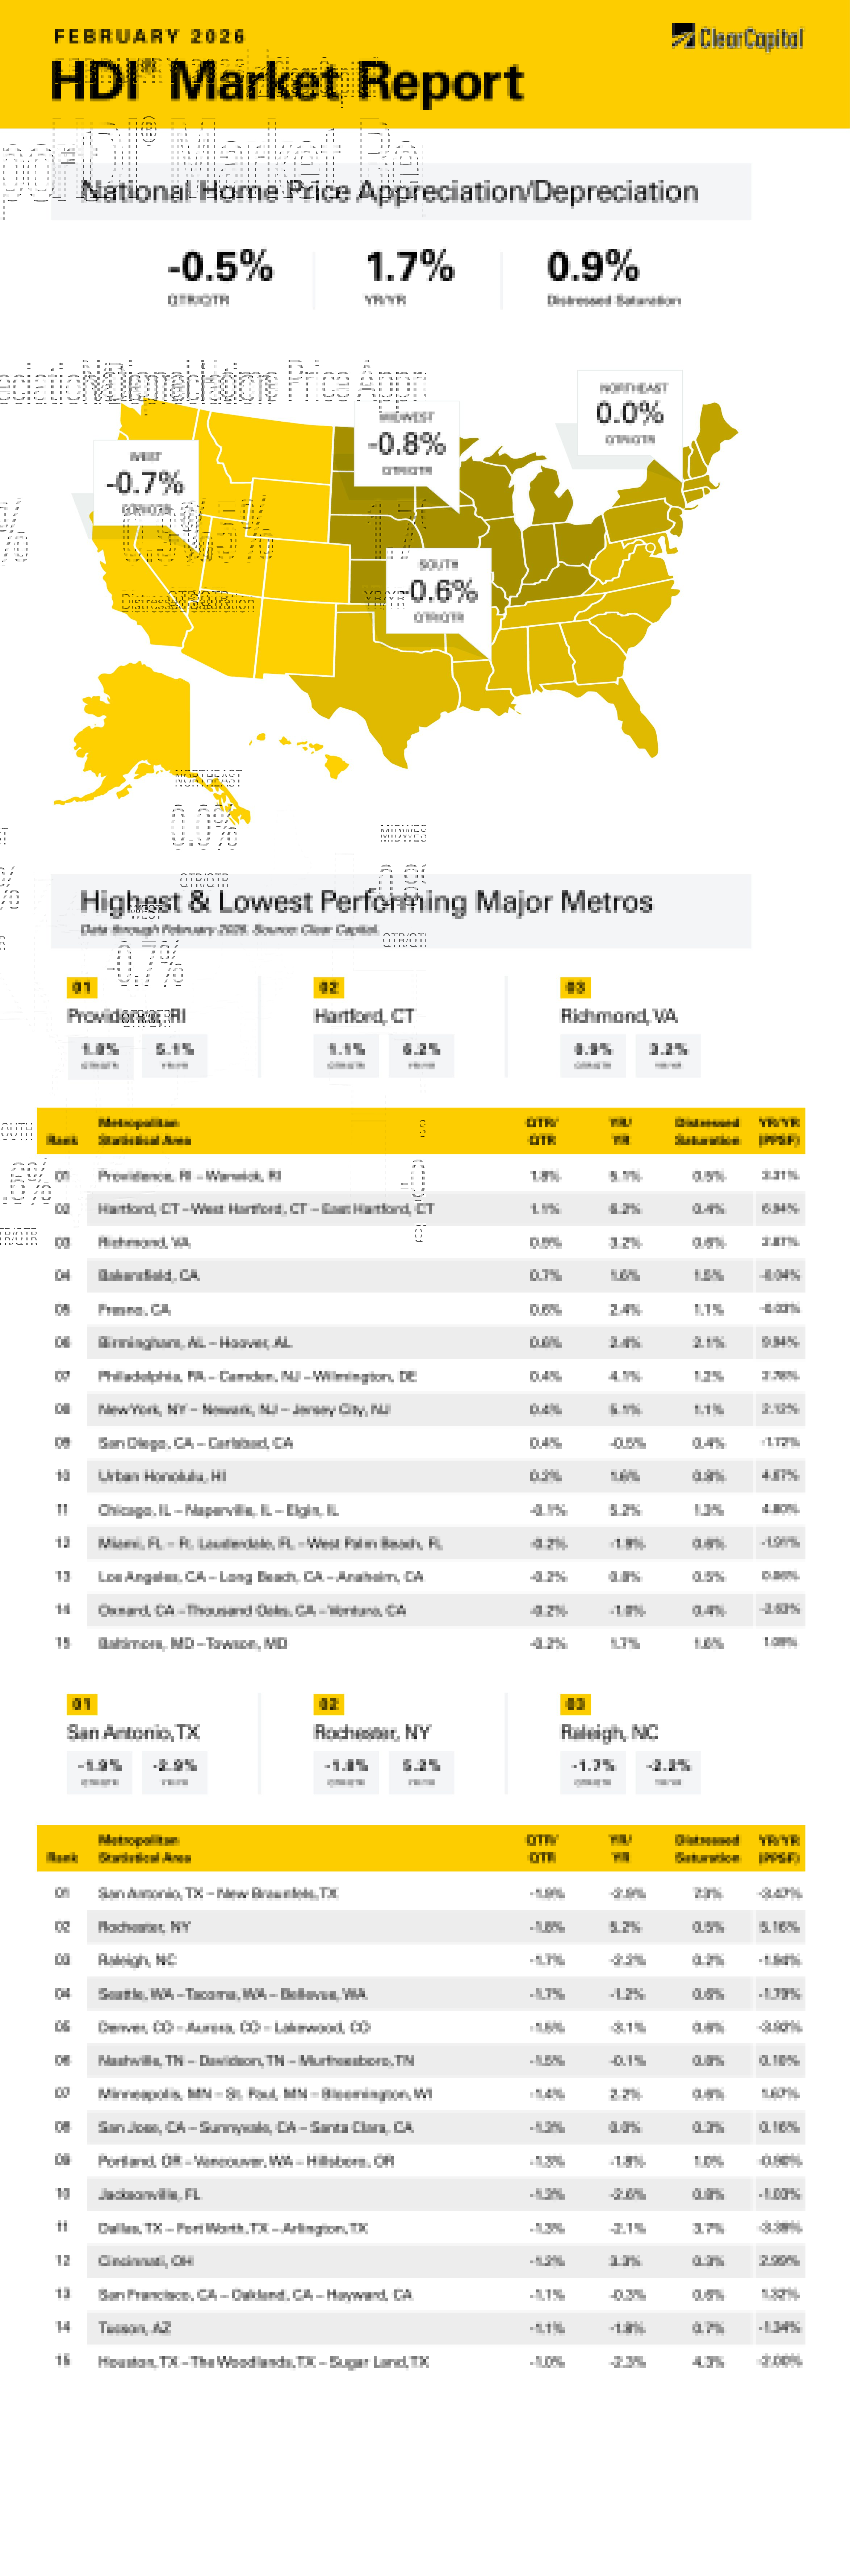
Home price appreciation remained negative in February, according to the Clear Capital Home Data Index. Nationally, home prices fell 0.5% on a quarterly basis and rose 1.7% annually. The Northeast was flat on a quarterly basis, while the West, Midwest and the South were negative. Of the top 15 MSAs, 10 experienced positive quarterly growth, and five had negative growth.
The Northeast was the top market, rising 0.0% quarterly and 4.9% annually. The top Northeastern Metropolitan Statistical Area (MSA) was Providence, RI, where prices grew 1.8% on a quarterly basis and 5.1% annually. Hartford, CT was also a leader, rising 1.1% on a quarterly basis and 6.2% annually. In New York City, prices rose 0.4% on a quarterly basis and 5.1% annually. Philly was also strong, with prices rising 0.4% quarterly and 4.1% annually.
The Midwest was the next best performer, with prices falling 0.8% but rising 4.0% annually. Chicago was the top performer, with prices falling 0.1% on a quarterly basis and rising 5.2% on an annual basis. No other midwestern MSAs were in the top 15. Cincinnati, OH was one of the laggards, falling 1.2% on a quarterly basis and rising 3.3% annually.
The South came in third, where prices fell 0.6% on a quarterly basis and were flat on an annual basis. Richmond, VA was the top performer, with prices up 0.9% on a quarterly basis and up 3.2% annually. Birmingham, AL saw prices rise 0.6% on a quarter-over-quarter (QoQ) basis and 2.4% annually. Miami made the top 15 MSAs on a quarterly basis with prices falling 0.2% quarterly and 1.9% annually. Raleigh, NC was one of the worst performing MSAs, with prices falling 1.7% quarterly and 2.2% annually. Nashville was also a laggard.
The West came in last, where prices fell 0.7% on a quarterly basis and 0.3% annually. The top Western MSA was Fresno, CA, where prices rose 0.6% quarterly and 2.4% annually. Bakersfield, CA was also in the top 15, with prices increasing 0.7% quarterly and 1.6% annually. The worst performing MSA was Seattle, where prices fell 1.7% on a quarterly basis and 1.2% on an annual basis. Denver also struggled, with prices falling 1.5% on a quarterly basis and 3.1% on an annual basis. San Jose, CA saw prices fall 1.3% quarterly although they were flat on an annual basis.
The attack on Iran is still too new to draw any major conclusions, but it will probably amplify some of the problems we are seeing in credit. Rising energy prices and an increase in uncertainty cannot help but dampen consumer confidence and spending. Over the past month, private equity funds have taken some big hits as software valuations come back to Earth. Many of these stocks are down 33% or more, and some funds have limited or halted redemptions. Stocks have been priced for perfection, and credit spreads have indicated a complacent investor. Stock and bond markets are vulnerable to any sort of shock.
While the problems with the private equity companies are not directly related to the real estate market, credit issues have a habit of spreading and popping up in unexpected places. During the 2008 financial crisis, it wasn’t necessarily the bankruptcy of Bear Stearns and Lehman Brothers that got the government’s attention — it was the fact that the commercial paper market seized up and retailers were unable to fund inventory for the holiday shopping season.
There is some overlap between these PE funds and the residential real estate market. Blue Owl Capital is big in multifamily, while Apollo buys a lot of non-government guaranteed mortgages. We have seen appraisal frauds proliferate, from Baltimore earlier this year, to Philadelphia, and now Chicago and Trenton, NJ. These areas are ground zero for non-QM (non-qualified mortgages), which are the bread and butter of smaller real estate investors.
Professional real estate investors have seen a trend of declining asking rents along with increasing property taxes, maintenance costs and insurance rates. Projects that may have penciled out in 2022 are seeing expected returns diminish as operating costs increase faster than rents. Delinquencies are rising across the board, which will eventually cause lenders to restrict credit. What will a pullback in credit mean for residential real estate prices?
If the current crunch remains contained in software/private equity and non-QM lending, the effect on real estate prices should be relatively minimal. Unlike 2008, the vast majority of mortgage-backed securities are guaranteed by the US Government, so investors will be paid in full. Foreclosures are increasing but are still below 2019 levels. Non-QM is growing, however it is still a fraction of the total mortgage market. There are about $218 billion in non-QM mortgages outstanding right now compared with about $9.5 trillion in subprime mortgages in 2008. The situations aren’t remotely comparable. If we do get a credit contagion, it won’t be because of non-QM lending.
If we do see increased stress in credit, it will probably encourage the Fed to cut rates sooner rather than later. The backdrop is becoming more favorable for rate cuts (energy prices notwithstanding). The Supreme Court ruling means that tariffs are on borrowed time. Absent tariffs, inflation would be at or very close to the Fed’s 2% target. With monetary policy still above the neutral rate of interest, the Fed can cut rates without stimulating the economy.
If the Fed cuts rates, will we see a replay of 2021, when real estate prices rose 20%? Probably not. The Fed won’t purchase mortgage-backed securities and we probably won’t see the Fed take the Fed Funds rate down to zero. A decrease in mortgage rates will probably help increase home sales as the rate lock-in effect decreases. Homebuilders are sitting on inventory and this will help them move the merchandise. Falling rates should help alleviate the rate lock-in effect and increase existing home sales. The spring selling season has just begun and this would go a long way towards making 2026 one of the better years for the residential real estate sector.
About the Clear Capital Home Data Index (HDI®) Market Report and Forecast
The Clear Capital HDI Market Report and Forecast provides insights into market trends and other leading indices for the real estate market at the national and local levels. A critical difference in the value of Clear Capital’s HDI Market Report and Forecast is the capability to provide more timely and granular reporting than nearly any other home price index provider.
Clear Capital’s HDI Methodology
• Generates the timeliest indices in patent pending, rolling quarter intervals that compare the most recent four months to the previous three months. The rolling quarters have no fixed start date and can be used to generate indices as data flows in, significantly reducing multi-month lag time that may be experienced with other indices.
• Includes both fair market and institutional (real estate owned) transactions, giving equal weight to all market transactions and identifying price tiers at a market specific level. By giving equal weight to all transactions, the HDI is truly representative of each unique market.
• Results from an address-level cascade create an index with the most granular, statistically significant market area available.
• Provides weighted repeat sales and price-per-square-foot index models that use multiple sale types, including single-family homes, multi-family homes and condominiums.
The information contained in this report and forecast is based on sources that are deemed to be reliable; however, no representation or warranty is made as to the accuracy, completeness, or fitness for any particular purpose of any information contained herein. This report is not intended as investment advice, and should not be viewed as any guarantee of value, condition, or other attribute.