

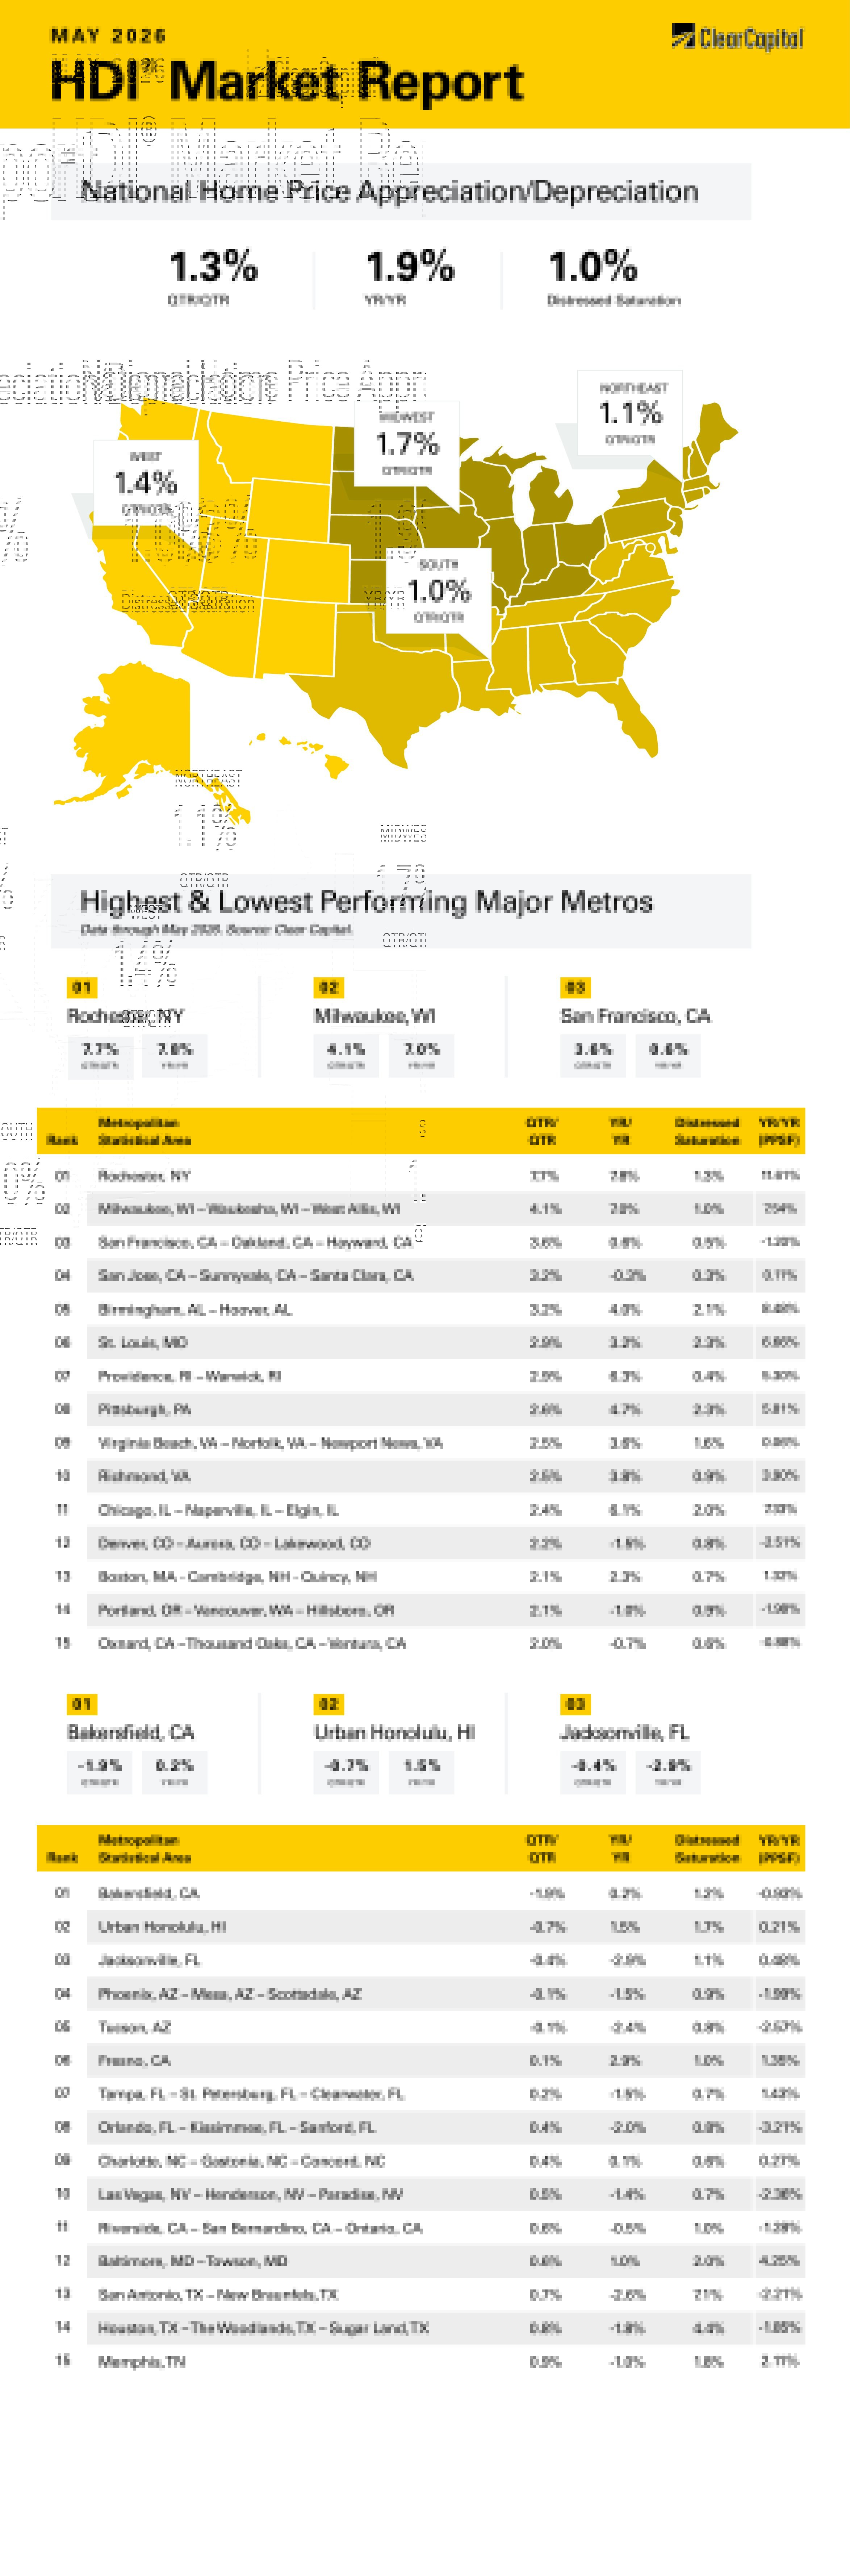
The May 2026 Clear Capital Home Data Index (HDI®) Market Report shows national quarter-over-quarter home price growth is at 1.3 percent.
Download the report, or read it below.
Commentary by Brent Nyitray of The Daily Tearsheet
Home price appreciation continued to improve in May, according to the Clear Capital Home Data Index. Nationally, home prices rose 1.3% on a quarterly basis and 1.9% annually after rising 0.6% quarterly in April. Every region rose on a quarterly basis, and only one was negative on an annual basis.
The Northeast remained the top market, rising 1.1% quarterly and 4.8% annually. The top Northeastern metropolitan statistical area (MSA) was Rochester, NY, where prices grew 7.7% on a quarterly basis and 7.8% annually. Providence, RI was also a leader, rising 2.9% on a quarterly basis and 6.3% annually. In Boston, prices rose 2.1% on a quarterly basis and 2.3% annually.
The Midwest was the next-best performer, with prices rising 1.7% quarterly and 4.1% annually. Milwaukee, WI showed impressive growth, rising 4.1% quarterly and 7.0% annually. Chicago rose 2.4% quarterly and 6.1% annually, while St. Louis, MO rose 3.2% quarterly and 3.2% annually.
The South came in third, where prices rose 1.0% on a quarterly basis and 0.3% on an annual basis. Birmingham, AL was the leader where prices rose 3.2% on a quarterly basis and 4.0% annually. Richmond, VA, was in the top 15, where prices rose 2.5% on a quarter-over-quarter (QoQ) basis and 3.8% annually. Jacksonville, FL was the worst Southern MSA, with prices falling 0.4% quarterly and 2.9% annually. Tampa, FL saw prices rise 0.2% quarterly although they fell 1.5% annually.
The West came in last, where prices rose 1.4 on a quarterly basis but fell 0.1% annually. The top Western MSA was San Francisco, where prices rose 3.6% quarterly and 0.6% annually. San Jose, CA was also in the top 15, with prices increasing 3.2% quarterly and down 0.3% annually. The worst quarterly performing MSA was Bakersfield, CA, where prices fell 1.9% on a quarterly basis and rose 0.2% on an annual basis. Phoenix saw prices fall 0.1% quarterly and 1.5% on a year-over-year (YoY) basis.
Home price appreciation has been decelerating since the pandemic years when home prices spiked over 20%. Current home price appreciation is below 2% which is below the inflation rate of 3.8%. This means that real (inflation-adjusted) home prices are falling. This is good news for the first time homebuyer, but it comes with some unwanted side effects. Falling home prices are correlated with increased delinquencies, and we are seeing signs of borrower stress through higher impairment numbers.
That said, delinquencies are not rising in a uniform manner — we are seeing a divergence between types of loans. For example, Fannie and Freddie loans (the majority of the market) have seen barely any increase at all. They are still very low on a historical basis: only about one half of one percent. On the other hand, FHA delinquencies are 6.6%, which is up about 2.1% compared to a year ago. Why the difference? FHA loans generally go to lower credit and lower income borrowers. FHA offers a 3% down product designed for the first-time homebuyer. Fannie and Freddie offer similar products, although they are harder to get. FHA borrowers generally have the least amount of financial flexibility to handle an increase in inflation or a hiccup in the economy.
We are also seeing delinquencies increase in the non-QM space, which is generally reserved for professional real estate investors and wealthy borrowers. Delinquencies are similar to FHA levels — around 7%. There are two basic flavors of non-QM loans: ones based on rental income and ones based on bank statement income. Bank statement loans are targeted towards small business owners who may not show a lot of income but exhibit strong cash flow. These loans are seeing the most stress, indicating that things on Main Street are not as sanguine as Wall Street. Bank statement loans are also used to purchase luxury homes by borrowers who might not have a lot of W2 income but have a lot of assets. The bank statement loans are exhibiting the highest delinquencies in this space.
The loans targeted towards professional real estate investors are seeing increased delinquencies as well, however they aren’t rising to the levels of the bank statement loans. This indicates that the rental market is still healthy, although that can vary by MSA. Rental loans generally require the borrower to put up a lot of equity, so borrowers have a big incentive to keep paying. Appraisal fraud has been an issue in some urban MSAs as some developers are using inflated appraisals to take out a cash-out refinance and walk away, leaving the lender holding the bag. Big picture, the pattern of delinquencies indicates some pain in the luxury market and the low end. The middle of the market and the rental market seem to be robust.
What does this mean for real estate prices overall? Nothing good. Delinquencies and lower prices go together. Given the affordability issues, it is hard to see increased demand pushing up prices. Moreover, the Fed can’t help with inflation at current levels. In fact, the futures market predicts a 50/50 chance of a rate hike this year which is negative for real estate prices. The problems with high-end loans imply that the luxury sellers are trapped in properties they cannot sell. Meanwhile, while there is plenty of demand at lower price points, inflation is squeezing disposable incomes and making buyers hesitant. Until prices fall or wages increase the low end of the mortgage market should still see stress, which isn’t going to help push up prices. Expect to see real estate prices flatline until affordability improves, either via wage hikes or lower rates.
About the Clear Capital Home Data Index (HDI®) Market Report and Forecast
The Clear Capital HDI Market Report and Forecast provides insights into market trends and other leading indices for the real estate market at the national and local levels. A critical difference in the value of Clear Capital’s HDI Market Report and Forecast is the capability to provide more timely and granular reporting than nearly any other home price index provider.
Clear Capital’s HDI Methodology
• Generates the timeliest indices in patent pending, rolling quarter intervals that compare the most recent four months to the previous three months. The rolling quarters have no fixed start date and can be used to generate indices as data flows in, significantly reducing multi-month lag time that may be experienced with other indices.
• Includes both fair market and institutional (real estate owned) transactions, giving equal weight to all market transactions and identifying price tiers at a market specific level. By giving equal weight to all transactions, the HDI is truly representative of each unique market.
• Results from an address-level cascade create an index with the most granular, statistically significant market area available.
• Provides weighted repeat sales and price-per-square-foot index models that use multiple sale types, including single-family homes, multi-family homes and condominiums.
The information contained in this report and forecast is based on sources that are deemed to be reliable; however, no representation or warranty is made as to the accuracy, completeness, or fitness for any particular purpose of any information contained herein. This report is not intended as investment advice, and should not be viewed as any guarantee of value, condition, or other attribute.