Providence, R.I. unseats Las Vegas as highest-performing metro nationwide
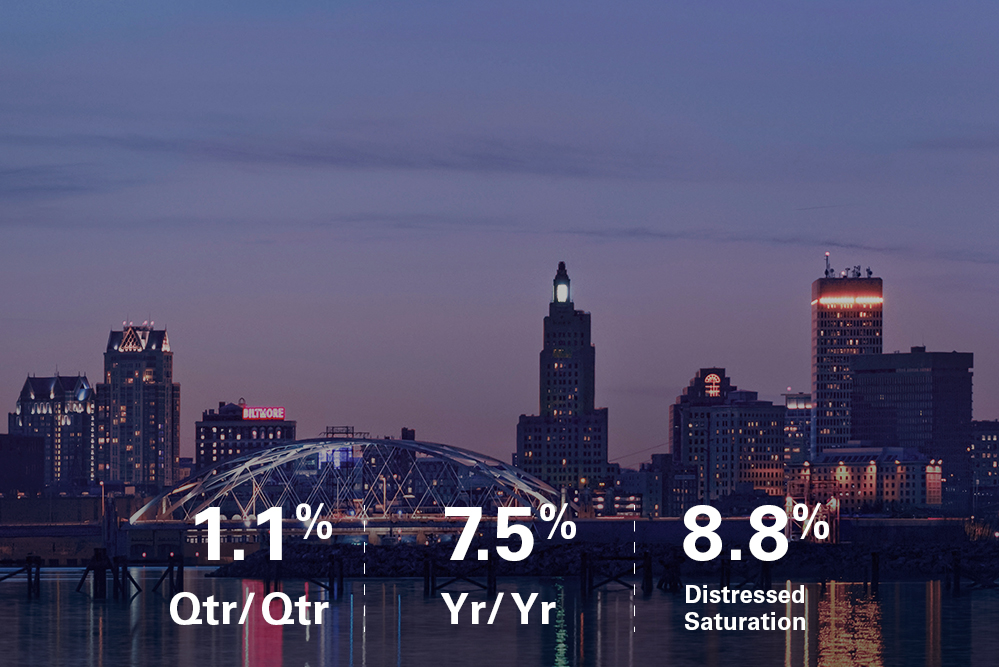
National quarter-over-quarter (QoQ) home price growth grew 0.1 percent to 1.1 percent for February. National year-over-year growth (YoY) also grew 0.1 percent to 7.5 percent for February. All data reported is based upon Clear Capital’s patent-pending QoQ measurement, which uses the newest data to create timely indices in rolling-quarter intervals, significantly reducing multi-month lag time that may be experienced with other indices.
West Region
The West maintained 1 percent QoQ growth for February. YoY growth fell 0.2 percent to 7.9 percent.
Las Vegas was unseated from its spot as the highest-performing metro nationwide, falling 0.14 percent to 1.91 percent QoQ growth and claiming second place. San Jose, California remained in the 15 highest-performing metros nationwide, falling 0.09 percent to 1.24 percent QoQ growth, and falling 1.28 percent to 12.52 percent YoY growth.
West metros among the 15 highest-performing metros nationwide:
- Oxnard, Calif. grew 0.17 percent to 1.62 percent QoQ growth
- Tucson, Ariz. grew 0.06 percent to 1.48 percent QoQ growth
- Phoenix, Ariz. grew 0.08 percent to 1.25 percent QoQ growth
Six of the 15 lowest-performing metros nationwide were from the West, with four of those six metros from California:
- Portland, Ore. grew 0.14 percent to 0.72 percent QoQ growth
- Los Angeles, Calif. grew 0.05 percent to 0.68 percent QoQ growth
- Bakersfield, Calif. fell 0.13 percent to 0.67 percent QoQ growth
- Sacramento, Calif. grew 0.01 percent to 0.59 percent QoQ growth
- San Diego, Calif. fell 0.04 percent to 0.46 percent QoQ growth
- Seattle, Wash. fell 0.16 percent to 0.36 percent QoQ growth
California saw a 0.01 percent decrease in QoQ growth statewide.
Northeast Region
The Northeast saw positive growth in all major metros, growing 0.2 percent to 1.3 percent QoQ growth for February. YoY growth grew 0.5 percent to 8.6 percent.
Providence, Rhode Island was the nation’s highest-performing metro, at 2.2 percent QoQ growth, and improving 0.61 percent.
Northeast metros among the 15 highest-performing metros nationwide:
- New York, N.Y. grew 0.18 percent to 1.29 percent QoQ growth
- Philadelphia, Pa. grew 0.29 percent to 1.36 percent QoQ growth
Pittsburgh grew 0.28 percent to 0.83 percent QoQ growth, and grew 1.01 percent to 6.86 percent YoY growth.
Northeast metros among the 15 lowest-performing metros nationwide:
- Rochester, N.Y. grew 0.17 percent to 0.61 percent QoQ growth
- Hartford, Conn. was the nation’s lowest-performing metro, despite growing 0.19 percent to 0.08 percent QoQ growth
South Region
The South grew 0.1 percent to 1 percent QoQ growth for February.
South metros among the 15 highest-performing metros nationwide:
- New Orleans, La. grew 0.44 percent to 1.66 percent QoQ growth
- Tampa, Fla. grew 0.08 percent to 1.31 percent QoQ growth
- Orlando, Fla. grew 0.18 percent to 1.29 percent QoQ growth
- Jacksonville, Fla. fell 0.04 percent to 1.29 percent QoQ growth
- Baltimore, Md. grew 0.37 percent to 1.24 percent QoQ growth
South metros among the 15 lowest-performing metros nationwide:
- Birmingham, Ala. fell 0.07 percent to 0.71 percent QoQ growth
- Richmond, Va. grew 0.06 percent to 0.7 percent QoQ growth
- Dallas, Texas grew 0.06 percent to 0.68 percent QoQ growth
- Washington, D.C. grew 0.15 percent to 0.65 percent QoQ growth
- Raleigh, N.C. fell 0.11 percent to 0.61 percent QoQ growth
- Virginia Beach, Va. maintained 0.59 percent QoQ growth
- San Antonio, Texas fell 1.4 percent to 0.56 percent QoQ growth
San Antonio, Texas experienced the largest contraction nationwide, falling 1.4 percent to 0.56 percent QoQ growth, and falling 5.07 percent to 5.57 percent YoY growth.
Midwest Region
The Midwest grew 0.1 percent to 1.1 percent QoQ growth for February.
Only two metros from the Midwest made it to the 15 highest-performing metros nationwide:
- Cleveland, Ohio grew 0.09 percent to 1.46 percent QoQ growth
- Detroit, Mich. fell 0.21 to 1.28 percent QoQ growth
No Midwest metros were among the 15 lowest-performing metros nationwide, with the remaining eight Midwest metros experiencing an average growth of 0.95 percent QoQ growth.
About the Clear Capital Home Data Index™ (HDI™) Market Report
The Clear Capital HDI Market Report provides insights into market trends and other leading indices for the real estate market at the national and local levels. A critical difference in the value of Clear Capital’s HDI Market Report is the capability to provide more timely and granular reporting than nearly any other home price index provider.
Clear Capital’s HDI Methodology
- Generates the timeliest indices in patent pending, rolling quarter intervals that compare the most recent four months to the previous three months. The rolling quarters have no fixed start date and can be used to generate indices as data flows in, significantly reducing multi-month lag time that may be experienced with other indices.
- Includes both fair market and institutional (real estate owned) transactions, giving equal weight to all market transactions and identifying price tiers at a market specific level. By giving equal weight to all transactions, the HDI is truly representative of each unique market.
- Results from an address-level cascade create an index with the most granular, statistically significant market area available.
- Provides weighted repeat sales and price-per-square-foot index models that use multiple sale types, including single-family homes, multi-family homes and condominiums.
The information contained in this report is based on sources that are deemed to be reliable; however, no representation or warranty is made as to the accuracy, completeness, or fitness for any particular purpose of any information contained herein. This report is not intended as investment advice, and should not be viewed as any guarantee of value, condition, or other attribute.


