


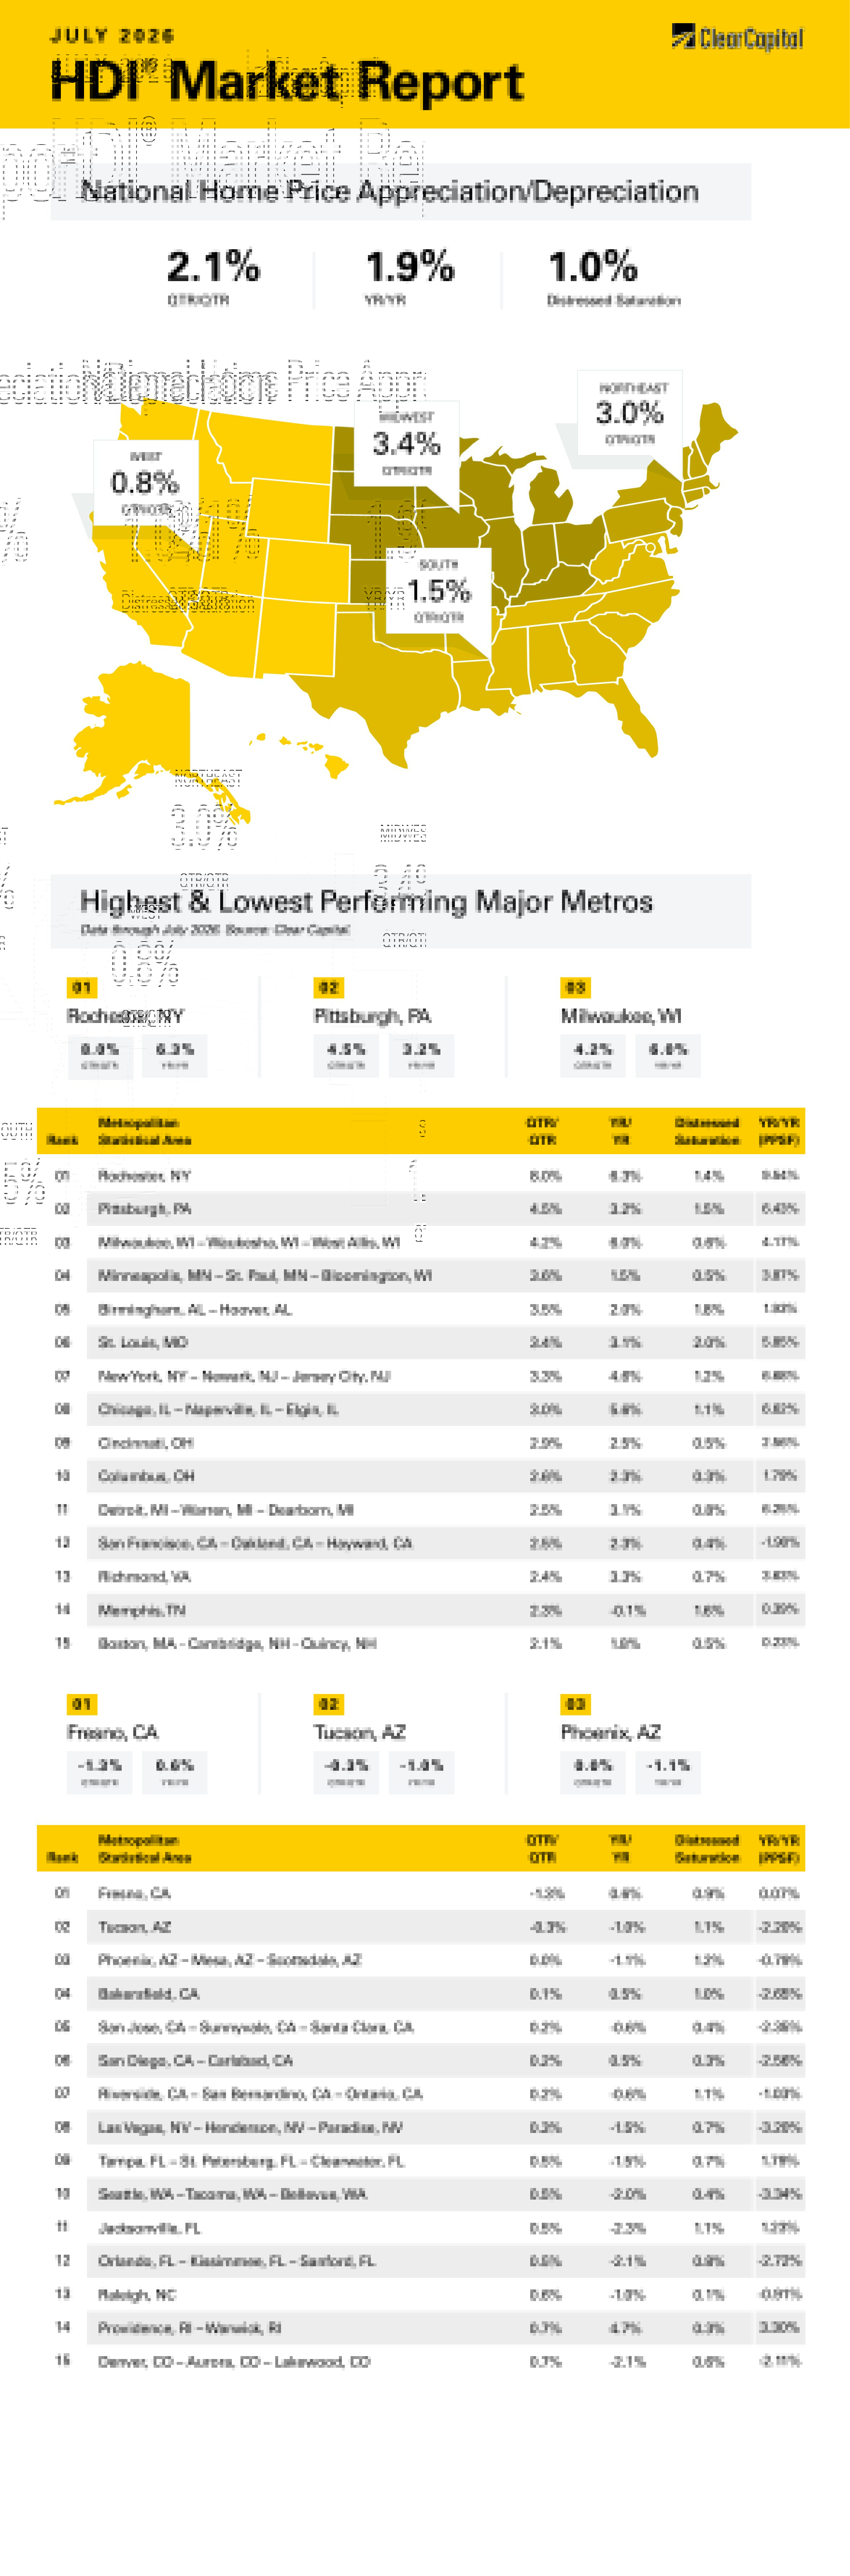
The July 2026 Clear Capital Home Data Index (HDI®) Market Report shows national quarter-over-quarter home price growth is at 2.1 percent.
Download the report, or read it below.
Commentary by Brent Nyitray of The Daily Tearsheet
Home price appreciation continued in July, according to the Clear Capital Home Data Index. Nationally, home prices rose 2.1% on a quarterly basis and 1.9% annually after rising 2.2% quarterly in June. Every region improved on a quarterly and annual basis. Despite an increase in mortgage rates, home price appreciation is picking up again.
The Midwest took the top spot, with prices rising 3.4% quarterly and 3.9% annually. The top metropolitan statistical area (MSA) was Milwaukee, WI, where prices rose 4.2% quarterly and 6.0% annually. Minneapolis, MN was next, rising 3.6% quarterly and 1.5% annually. Chicago rose 3.0% quarterly and 5.6% annually, while St. Louis, MO rose 3.4% quarterly and 3.1% annually. Seven of the top 15 metro areas were in the Midwest last month.
The Northeast came in second, rising 3.0% quarterly and 4.4% annually. The top Northeastern MSA remained Rochester, NY, where prices grew 8% quarterly and 6.3% annually. New York City saw prices rise 3.3% quarterly and 4.6% annually. In Boston, prices rose 2.1% on a quarterly basis and 1.8% annually.
The South came in third, where prices rose 1.5% on a quarterly basis and 0.6% on an annual basis. Birmingham, AL was the leader where prices rose 3.5% on a quarterly basis and 2.0% annually. Richmond, VA was in the top 15, where prices rose 2.4% on a quarter-over-quarter (QoQ) basis and 3.3% annually. Florida continues to struggle, with three MSAs in the bottom 15. Tampa prices rose 0.5% quarterly and fell 1.5% annually. Jacksonville and Orlando also landed in the bottom 15.
The West came in last, where prices rose 0.8 on a quarterly basis and 0.1% annually. The top Western MSA was San Francisco, where prices rose 2.5% quarterly and 2.3% annually. Western MSAs accounted for nine out of the top 10 lowest performing MSAs with Fresno, CA down 1.3% quarterly and Tucson, AZ down 0.3%. Other Western MSAs that landed in the basement were Phoenix, AZ; Bakersfield, CA; San Jose, CA (which had been a top 15 MSA last month); and San Diego.
While we are seeing an improvement in real estate prices for existing homes, how are things for the residential construction sector? Based on homebuilder sentiment and the latest earnings numbers, not great. Homebuilder sentiment, as measured by the National Association of Home Builders (NAHB) and Wells Fargo is back down where it was in the aftermath of the burst residential real estate bubble.
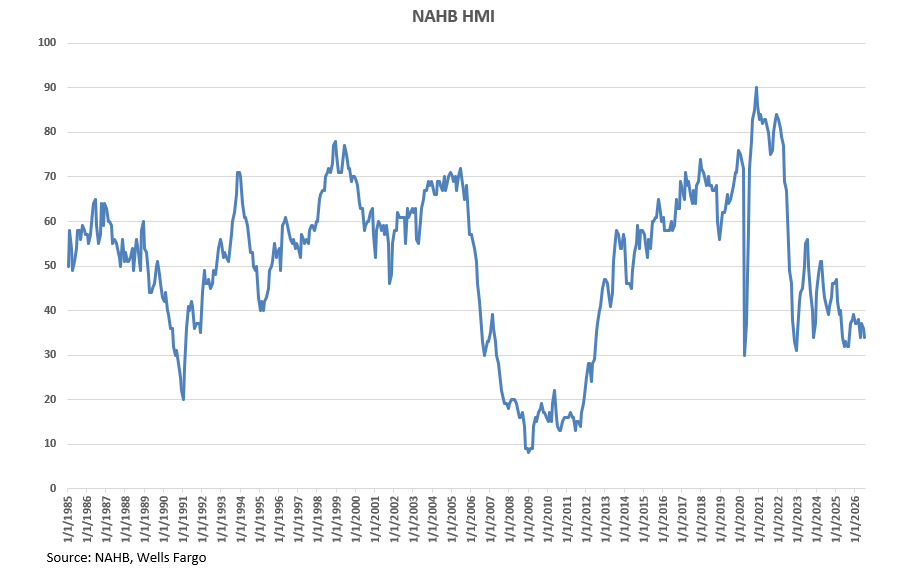
Home price appreciation has been modestly positive, and there is certainly an appetite for new homes, but this is not translating into better business conditions for the builders. Sentiment has remained below 40 for 15 consecutive months, which is the worst since 2012.
Part of the problem is the sentiment of home buyers, especially the first-time homebuyer. The overall mood is being dampened by uncertainty. The consumer sentiment indices remain moribund, although consumer sentiment indices are often driven by gasoline prices. That said, NAHB mentioned that consumers are worried about the job market, and uncertainty over mortgage rates and jobs generally means would-be buyers are cautious.
The homebuilders reported lower earnings on a year-over-year (YoY) basis, and almost everyone saw decreasing gross margins. Gross margins represent the difference between a home’s sale price and the cost of building the home, which is mainly materials, land, and labor. While inflation has been top-of-mind, building materials prices are not the driver here. Homebuilders are sitting with a lot of inventory and are being forced to cut prices to move the merchandise.
The median price of a new home has fallen from $460,000 in late 2022 to $398,300 in the latest new home sales report from the Census Bureau. This is a whopping 13% decline in prices over that period. Some of the decline is due to product mix — builders are focusing on starter homes and if more starter homes than luxury homes are selling, the median price is going to fall. The luxury market is struggling, however.
While new home prices are stagnant or down since 2022, lot prices have risen about 4%. Shortages of skilled labor are keeping labor costs high, which is also pressuring margins. The gross margins may even be understated as builders are often offering discounted mortgage rates as an incentive to buy, which allows the builder to “maintain the comps.” All in all, it is a difficult environment for the builders, and many of them are allocating capital to stock buybacks, not new home builds. This is a clear signal about where they see the business going. If they were optimistic about the overall business environment, they would be buying land, not stock.
Homebuilders aren’t going to get much help in the mortgage rate department. Last week, the Fed maintained the Fed Funds rate at its current level of 3.5% – 3.75% but three members dissented, wanting to increase rates. There has been some relief in oil prices since the war in Iran began, however inflation remains well above the Fed’s 2% target. The September Fed Funds futures see a roughly 2/3 chance for a rate hike and a 1/3 chance for no change. Mortgage rates are not pegged to the Fed Funds rate, but a higher Fed Funds rate will usually translate into higher mortgage rates.
The bond market is getting used to Kevin Warsh, and one of his goals is to reduce the amount of guidance the Fed gives to markets. The new Federal Open Market Committee (FOMC) statements are more terse, and Warsh’s press conference was generally panned by the Street. Longer-term bond yields increased markedly in the aftermath, which means investors are skeptical of the Fed’s commitment to fighting inflation. The headwinds facing homebuyers, real estate investors and homebuilders will continue for the near term.
About the Clear Capital Home Data Index (HDI®) Market Report and Forecast
The Clear Capital HDI Market Report and Forecast provides insights into market trends and other leading indices for the real estate market at the national and local levels. A critical difference in the value of Clear Capital’s HDI Market Report and Forecast is the capability to provide more timely and granular reporting than nearly any other home price index provider.
Clear Capital’s HDI Methodology
• Generates the timeliest indices in patent pending, rolling quarter intervals that compare the most recent four months to the previous three months. The rolling quarters have no fixed start date and can be used to generate indices as data flows in, significantly reducing multi-month lag time that may be experienced with other indices.
• Includes both fair market and institutional (real estate owned) transactions, giving equal weight to all market transactions and identifying price tiers at a market specific level. By giving equal weight to all transactions, the HDI is truly representative of each unique market.
• Results from an address-level cascade create an index with the most granular, statistically significant market area available.
• Provides weighted repeat sales and price-per-square-foot index models that use multiple sale types, including single-family homes, multi-family homes and condominiums.
The information contained in this report and forecast is based on sources that are deemed to be reliable; however, no representation or warranty is made as to the accuracy, completeness, or fitness for any particular purpose of any information contained herein. This report is not intended as investment advice, and should not be viewed as any guarantee of value, condition, or other attribute.