

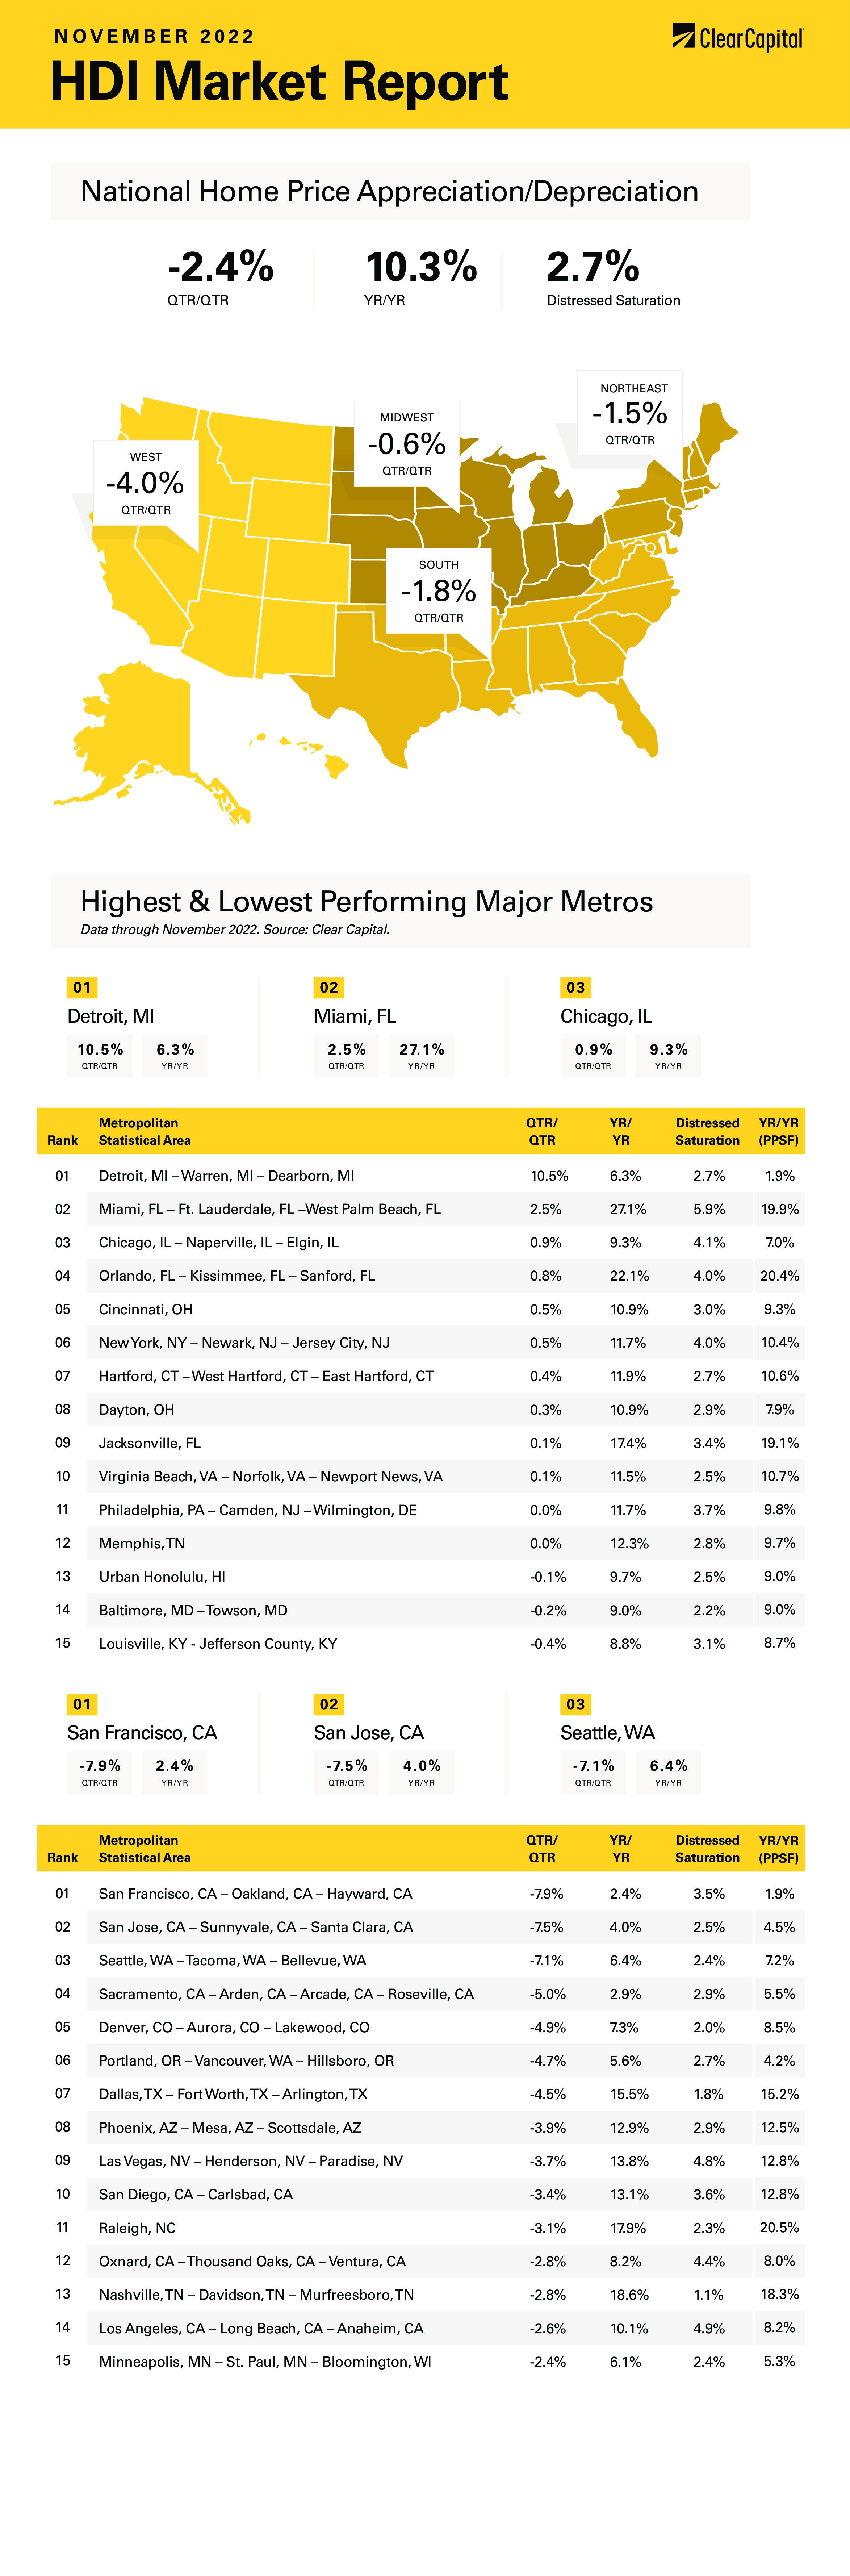
The November 2022 Home Data Index™ (HDI™) Market Report shows national quarter-over-quarter (QoQ) home price growth is at -2.4 percent.
Download the report, or read it below.
Commentary by Brent Nyitray of The Daily Tearsheet
Home price appreciation decelerated again in November as the Clear Capital Home Data Index fell 2.4% quarter-over-quarter (QoQ) and rose 10.3% on a year-over-year (YoY) basis. This compares to a 0.5% QoQ increase,and a 12.6% YoY increase in October. Every region reported declines, and the gainers were a mix of Florida cities and historical laggards.
The Midwest held up best, only falling 0.6% QoQ and rising 7.8% YoY. The leading MSA was Detroit, which rose 10.5% QoQ and 6.3% YoY. Cincinnati rose 10.9% YoY and Chicago was up 9.3%. The midwestern MSAs really didn’t have the same sort of robust rebound after 2012 the way the West did.
The Northeast came in second, falling 1.5% on a quarterly basis. Annual growth came in at 10.5%, with Hartford (up 11.9%) and the New York City area (up 11.7%) leading the way. Like the Midwest, the Northeast didn’t have the same sort of robust home price appreciation after 2012 like other regions.
The South came in next, where prices fell 1.8% QoQ, however it did post the biggest YoY gain at 13.8%. Florida remains exceptionally strong, with Miami up 27.1%, Orlando up 22%, and Jacksonville up 17.4%. The hurricanes seem to have begun to impact price growth in the state.
Finally, the West saw a 4.0% QoQ decline in prices. Prices still rose 8.5% on a YoY basis. Some of the hottest markets are finally taking a breather. San Francisco experienced the biggest quarterly decline, falling 7.9%. San Jose was down 7.5%, while Seattle fell 7.1%. The combination of rising rates and prices have made much of California unaffordable for newcomers.
The theme of the past month has been the continued decline in real estate prices, along with signs that the Fed is getting some traction in its battle against inflation. In early November, the Consumer Price Index showed a marked decline in the monthly change in the core rate of inflation. This report sparked a rally in the bond market and drove the 10-year bond yield down towards 3.75%. Since then, the market has trimmed its expectations for rate hikes going forward.
Recent comments from the Federal Reserve indicate that the pace of rate hikes is about to slow. At a speech at Brookings Institution, Fed Chair Jerome Powell alluded to a slowdown in rate hikes which could begin as early as the December 2022 FOMC meeting. That said, he believes that the mistake of the 1970s was easing too early and a period of below-trend growth will be necessary to get the demand destruction required to lower inflationary expectations.
Core Inflation (ex-food and energy) comes from three major categories – core goods inflation, housing services inflation, and core services inflation (ex-housing). Core goods inflation has been mainly due to supply chain issues which have largely been fixed. Core services inflation (ex-housing) has been fluctuating and housing services inflation has been rising rapidly. Housing services inflation is basically rent and owner’s equivalent rent and this has been the driver of core inflation over the past year.
This component of inflation tends to lag other inflation because residential leases only reset once a year. During the pandemic, new lease inflation was running at 20%, however it has recently begun to decelerate. The Fed expects this component of inflation to last through mid-2023.
The most important category is services ex-housing and this is driven by wage inflation. This includes health care services, haircuts, education, etc. This is a function of the supply and demand imbalance in the labor market. The Fed would like to see more workers re-enter the market which would be the most painless way to address the imbalance.
We are seeing a big slowdown in some of the markets that benefited the most from the flight out of the cities during the pandemic. Places like Phoenix, Austin, Las Vegas, and Boise saw prices rocket as real-estate rich Californians bought properties in these areas using some of the inflated equity in their homes. It seems that the music has stopped, and these MSAs are appearing vulnerable.
The initial wave of rich Californians has passed, and those that might consider the same trade (selling in CA and buying in Boise) are finding it more difficult to sell their CA homes and the bargains of 2020 are no more. At some point, home prices in these MSAs will have to be supported by the strength of the local economy, which means falling to an appropriate level compared to wages in the area.
The first-time homebuyer might be getting some relief, however. The Federal Housing Finance Agency just increased its conforming loan limits by 12% to $726,200. This means more buying power for homebuyers. In addition, the yield curve continues to invert, which means that short-term interest rates are increasing while long-term interest rates are staying the same. Mortgage-backed securities are attractive compared to Treasuries, and we should see investors begin to re-enter the space as volatility subsides. These three components should help affordability issues going into 2023.
About the Clear Capital Home Data Index™ (HDI™) Market Report and Forecast
The Clear Capital HDI Market Report and Forecast provides insights into market trends and other leading indices for the real estate market at the national and local levels. A critical difference in the value of Clear Capital’s HDI Market Report and Forecast is the capability to provide more timely and granular reporting than nearly any other home price index provider.
Clear Capital’s HDI Methodology
• Generates the timeliest indices in patent pending, rolling quarter intervals that compare the most recent four months to the previous three months. The rolling quarters have no fixed start date and can be used to generate indices as data flows in, significantly reducing multi-month lag time that may be experienced with other indices.
• Includes both fair market and institutional (real estate owned) transactions, giving equal weight to all market transactions and identifying price tiers at a market specific level. By giving equal weight to all transactions, the HDI is truly representative of each unique market.
• Results from an address-level cascade create an index with the most granular, statistically significant market area available.
• Provides weighted repeat sales and price-per-square-foot index models that use multiple sale types, including single-family homes, multi-family homes and condominiums.
The information contained in this report and forecast is based on sources that are deemed to be reliable; however, no representation or warranty is made as to the accuracy, completeness, or fitness for any particular purpose of any information contained herein. This report is not intended as investment advice, and should not be viewed as any guarantee of value, condition, or other attribute.