

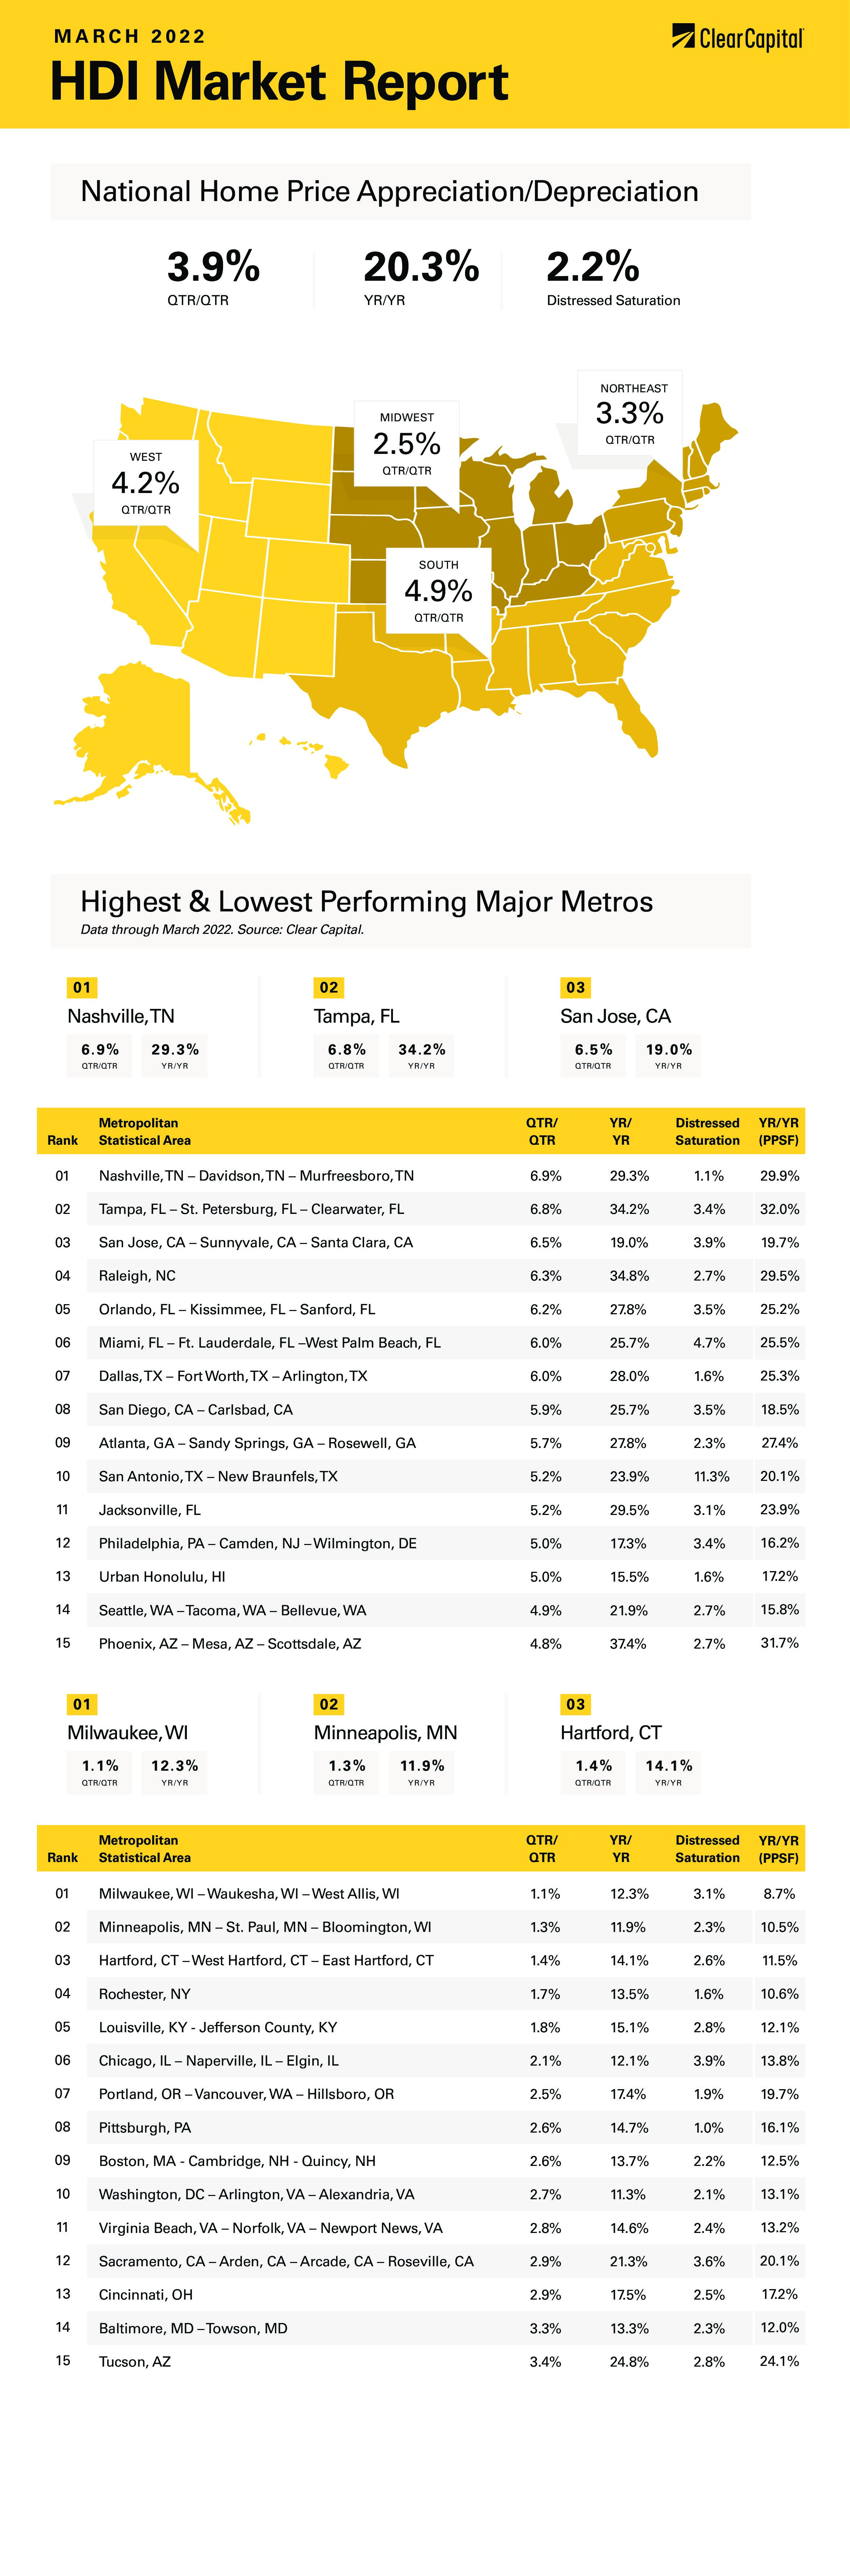
The March 2022 Home Data Index™ (HDI™) Market Report shows national quarter-over-quarter (QoQ) home price growth is at 3.9 percent.
Download the report, or read it below.
Commentary by Brent Nyitray of The Daily Tearsheet
Home price appreciation accelerated in March as the Clear Capital Home Data Index rose 3.9% quarter-over-quarter (QoQ) and 20.3% on a year-over-year (YoY) basis. This was a pickup from the February pace of 3.4% QoQ and 19.6% YoY. Every region reported home price appreciation, although some of the hottest markets like Phoenix are seeing quarterly price appreciation drop back from their exceptional growth over the past 6 months.
The fastest growing region was the South, which grew 24% last month. Nashville was the leader, with prices rising 29%. Other notable Southern MSAs include Tampa, where prices rose 34% and Raleigh, where they rose 35%.
The West came in second at 23.4%, with the usual suspects showing the most growth. The leader was Phoenix, where price rose 37% and San Diego where prices rose 26%. The Bay Area is accelerating, and prices rose 19% in the San Jose area.
The Midwest came in next, where prices rose 16% on a YoY basis. No Midwest MSAs made it into the top 15, however some of the laggards were there, including Milwaukee (up 12%) and Minneapolis (up 12%). In Chicago, prices rose 12% as well.
Finally, the Northeast saw a 15.9% increase in prices. The only Northeastern MSA that made the top 15 was Philadelphia, where prices rose 17%. Other notable Northeastern MSAs include Rochester NY, where prices rose 13% and Boston where they rose 14%.
What a difference a month makes with respect to interest rates. In my last blog post, I talked about the difference between the markets’ assessment of future interest rates and the Federal Reserve’s forecast. In that piece, I looked at the December 2021 dot plot which showed most voting members saw the Fed raising the Fed Funds rate to a range of 0.75% – 1%. The market’s forecast using the Fed Funds futures was much more hawkish, predicting that the Fed Funds rate would be somewhere between 1.5% and 2%.
The Fed raised the Fed Funds rate by a quarter of a percent at the March meeting and gave out a new set of economic projections. The part that got everyone’s attention was the dot plot, which increased its Fed Funds rate forecast to 1.75% – 2%. The Fed also took down its forecast for 2022 GDP growth from 4% to 2.8% and bumped up its inflation forecast from 2.6% to 4.3%. The unemployment forecast remained unchanged at 3.5%. You can see the comparison of the December plot and the March plot below. That is a big change in sentiment in only 3 months.
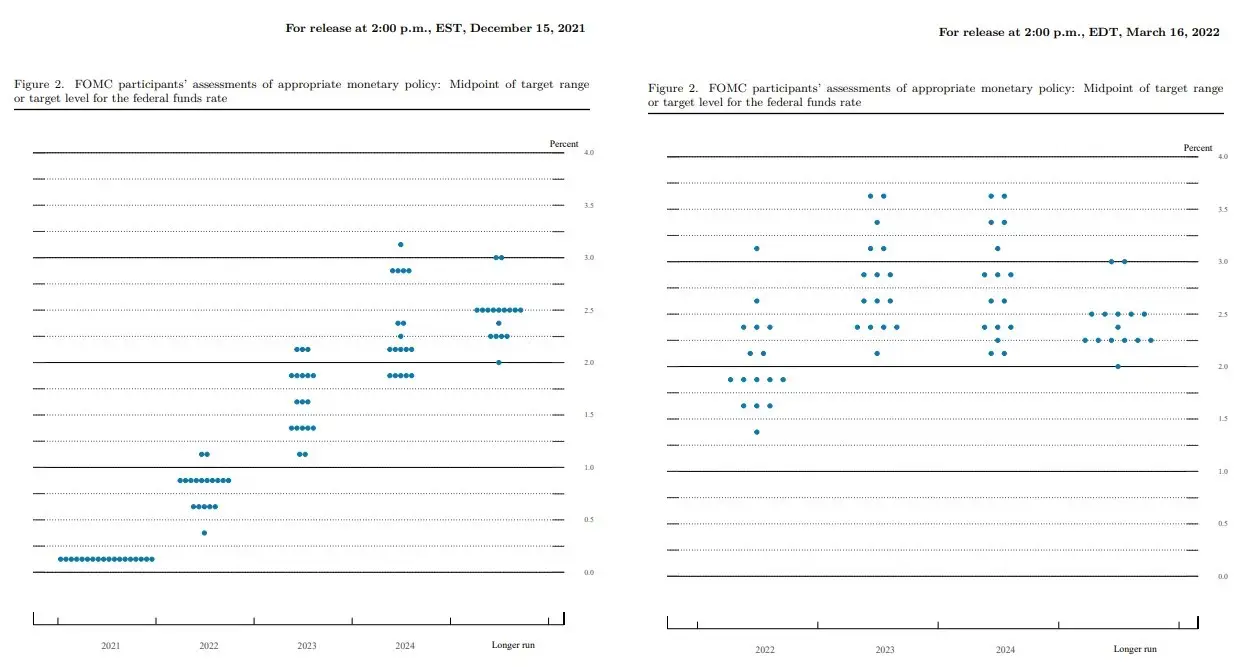 The markets are now predicting the Fed Funds rate will stand somewhere between 2.25% and 2.75% by the end of the year, so this forecast might be conservative. The Fed also indicated that it would like to start reducing its balance sheet, which spooked the mortgage market since those securities would likely be the ones sold off.
The Fed’s forecast amounts to an aggressive tightening cycle, and the biggest fear is that it triggers a recession without fixing inflation. That would give us a replay of the 1970s, where inflation and sluggish growth teamed up to create stagflation. If inflationary expectations get baked into people’s mindset, they will hoard and ask for annual cost-of-living increases, which cements inflationary expectations. That is what the Fed is trying to prevent.
The Fed has been willing to push the economy into a recession to dampen inflationary expectations in the past, and investors should realize the playbook of the last 40 years is out the window at this point. Watch the yield curve like a hawk, and if long-term rates drop below short-term rates that is a flashing red recessionary signal.
While the 1970s were miserable for a lot of people, real estate developers, farmers and oil drillers did exceptionally well. Residential real estate rose at an annualized rate of 10% during the 1970s. To put the 1970s real estate rally into perspective, the median home price rose by only 6.1% per year in the decade leading up the residential real estate bubble in 2006.
The Fed is paying close attention to house prices. Federal Reserve government Chris Waller said “With housing costs gaining an ever-larger weight in the inflation Americans experience, I will be looking even more closely at real estate to judge the appropriate stance of monetary policy” at a speech at Rutgers University recently.
Waller pointed out in his speech that the rapid rise in home prices was not due to leverage or relaxed lending standards, but by the state of supply and demand. This is exactly correct. The United States has underbuilt since the bubble burst and has created a situation where we sit with record low housing inventory. Even if the Fed raises rates aggressively, it might only affect the marginal buyer who is purchasing for investment reasons. The home price appreciation we have been seeing looks set to continue for a while longer.
About the Clear Capital Home Data Index™ (HDI™) Market Report and Forecast
The Clear Capital HDI Market Report and Forecast provides insights into market trends and other leading indices for the real estate market at the national and local levels. A critical difference in the value of Clear Capital’s HDI Market Report and Forecast is the capability to provide more timely and granular reporting than nearly any other home price index provider.
Clear Capital’s HDI Methodology
• Generates the timeliest indices in patent pending, rolling quarter intervals that compare the most recent four months to the previous three months. The rolling quarters have no fixed start date and can be used to generate indices as data flows in, significantly reducing multi-month lag time that may be experienced with other indices.
• Includes both fair market and institutional (real estate owned) transactions, giving equal weight to all market transactions and identifying price tiers at a market specific level. By giving equal weight to all transactions, the HDI is truly representative of each unique market.
• Results from an address-level cascade create an index with the most granular, statistically significant market area available.
• Provides weighted repeat sales and price-per-square-foot index models that use multiple sale types, including single-family homes, multi-family homes and condominiums.
The information contained in this report and forecast is based on sources that are deemed to be reliable; however, no representation or warranty is made as to the accuracy, completeness, or fitness for any particular purpose of any information contained herein. This report is not intended as investment advice, and should not be viewed as any guarantee of value, condition, or other attribute.