

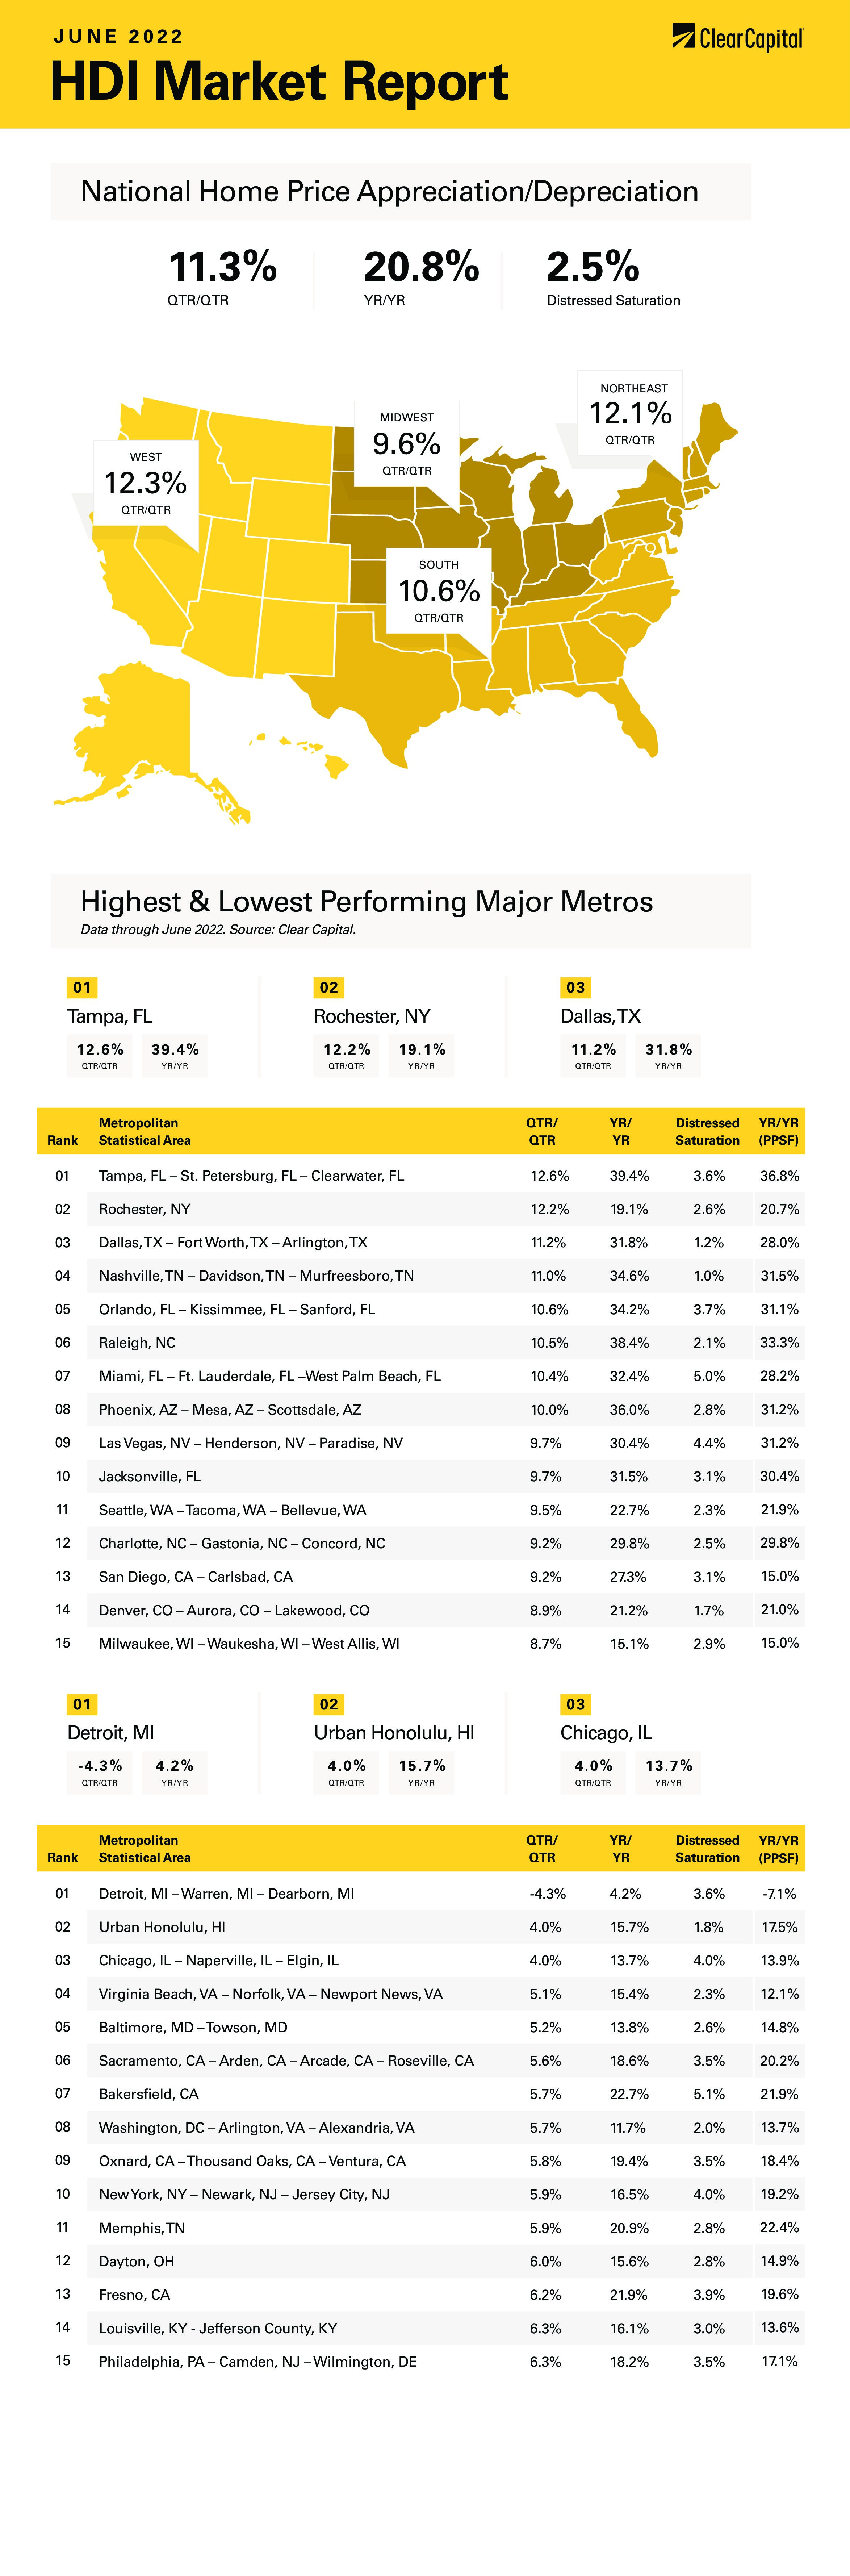
The June 2022 Home Data Index™ (HDI™) Market Report shows national quarter-over-quarter (QoQ) home price growth is at 11.3 percent.
Download the report, or read it below.
Commentary by Brent Nyitray of The Daily Tearsheet
Home price appreciation continued in June as the Clear Capital Home Data Index rose 11.3% quarter-over-quarter (QoQ) and 20.8% on a year-over-year (YoY) basis. These numbers compare to a QoQ gain of 8.9% and an annual gain of 21.9%. Every region reported home price appreciation, and some of the hottest markets on the West Coast are accelerating again.
The fastest growing region was the South, which grew 23.3% last month. Tampa was the leader, with prices rising 39%. Other notable Southern MSAs include Raleigh, where prices rose 38% and Nashville, where they rose 35%.
The West came in second at 22.2%, with the usual suspects showing the most growth. The leader was Phoenix, where prices rose 36% and Las Vegas where prices rose 30%. Seattle saw a 23% increase in home prices.
The Northeast came in next, where prices rose 20.7% on YoY basis. The Northeast did exhibit the largest quarterly increase, of 10.3%. Rochester was the leader in the Northeast, with prices rising 19%. This is the first time in a while where a Northeastern city made the top 15
Finally, the Midwest saw a 13.6% increase in prices. Milwaukee was the leader with a 15% increase in prices. The QoQ gain was 8.7%, so it appears prices may begin accelerating in this area of the country. This is also the first time a Midwestern MSA broke into the top 15 for some time.
May’s Consumer Price Index was a game-changer which prompted more aggressive action out of the Fed. Instead of hiking 50 basis points, as was expected before the report, the Fed hike 75 basis point and the Fed Funds future are a near-lock for another 75 at the July meeting. This 150 basis points of tightening is probably the most aggressive action taken by the Fed since the 1980s. Given that interest was quite high during the early-to-mid 80s, the effect of this increase is probably more dramatic this time around.
As quickly as inflation talk began, recession talk soon followed. The US economy shrank at a 1.5% annualized rate in the first quarter, and the Atlanta Fed’s GDP Now Index is zero. This was before the lousy housing starts number for May (down 14% month-over-month) which means housing remains a drag on the economy. The ISM numbers show manufacturing is decelerating, and consumption is weakening as evidenced by retail sales numbers. The lag time for tightening is typically at least 9 months, so the rate hikes so far have yet to filter through. If GDP is negative in Q2, we will officially be in a recession.
Jerome Powell said at his semiannual Humphrey-Hawkins testimony that the Fed will look for “compelling evidence” that inflation is coming down and that ongoing rate increases will be appropriate. In other words, the Fed will risk a recession to beat inflation.
The big question is whether this will cause a real estate crash. Given the memories of 2008, many prognosticators are looking for a repeat. While it is possible that some MSAs have hit the affordability wall and buyers cannot afford to pay more, the supply and demand situation is still heavily biased towards a seller’s market.
A big difference between today’s market and the peak of the bubble is that the type of subprime loans that financed the bubble no longer exist. The private label securitization market is a shadow of its former self, and only high-quality jumbos and non-qualified mortgages are making the cut. There are no pick-a-pay loans, and most non-QM / jumbo lending still require the borrower to put up at least 10%. This is not conducive for a wave of strategic defaults. There are no “forced sellers” out there. Most people have substantial equity in their homes and will probably prefer to wait out the storm.
The latest Existing Homes Sales report showed the median home price breached $400,000 for the first time ever, despite rapidly declining sales. So, despite rising interest rates, so far we aren’t seeing any effect on home prices. One thing to keep in mind is that if the US is heading into a recession, then the yield curve will flatten and even invert (which happens when short-term rates rise higher than long-term rates). It is not out of the realm of possibility that the peak in mortgage rates has already happened, especially if the inflation numbers begin to moderate. Pay closer attention to the month-over-month changes as opposed to the year-over-year changes. That is where the deceleration will be detected.
Ultimately the supply and demand imbalance will win out in the battle over home prices. Some MSAs which have experienced abnormally large growth rates may soften (think places like Phoenix and the Bay Area), while large swaths of the US continue their growth. Historically, housing has led the economy out of a recession, and given the abject shortage of housing in the US, a 2023 recovery might be the first time in almost 20 years that we get a housing-led recovery.
About the Clear Capital Home Data Index™ (HDI™) Market Report and Forecast
The Clear Capital HDI Market Report and Forecast provides insights into market trends and other leading indices for the real estate market at the national and local levels. A critical difference in the value of Clear Capital’s HDI Market Report and Forecast is the capability to provide more timely and granular reporting than nearly any other home price index provider.
Clear Capital’s HDI Methodology
• Generates the timeliest indices in patent pending, rolling quarter intervals that compare the most recent four months to the previous three months. The rolling quarters have no fixed start date and can be used to generate indices as data flows in, significantly reducing multi-month lag time that may be experienced with other indices.
• Includes both fair market and institutional (real estate owned) transactions, giving equal weight to all market transactions and identifying price tiers at a market specific level. By giving equal weight to all transactions, the HDI is truly representative of each unique market.
• Results from an address-level cascade create an index with the most granular, statistically significant market area available.
• Provides weighted repeat sales and price-per-square-foot index models that use multiple sale types, including single-family homes, multi-family homes and condominiums.
The information contained in this report and forecast is based on sources that are deemed to be reliable; however, no representation or warranty is made as to the accuracy, completeness, or fitness for any particular purpose of any information contained herein. This report is not intended as investment advice, and should not be viewed as any guarantee of value, condition, or other attribute.