

The February 2025 Home Data Index (HDI®) Market Report shows national quarter-over-quarter home price growth is at -0.2 percent.
Download the report, or read it below.
Commentary by Brent Nyitray of The Daily Tearsheet
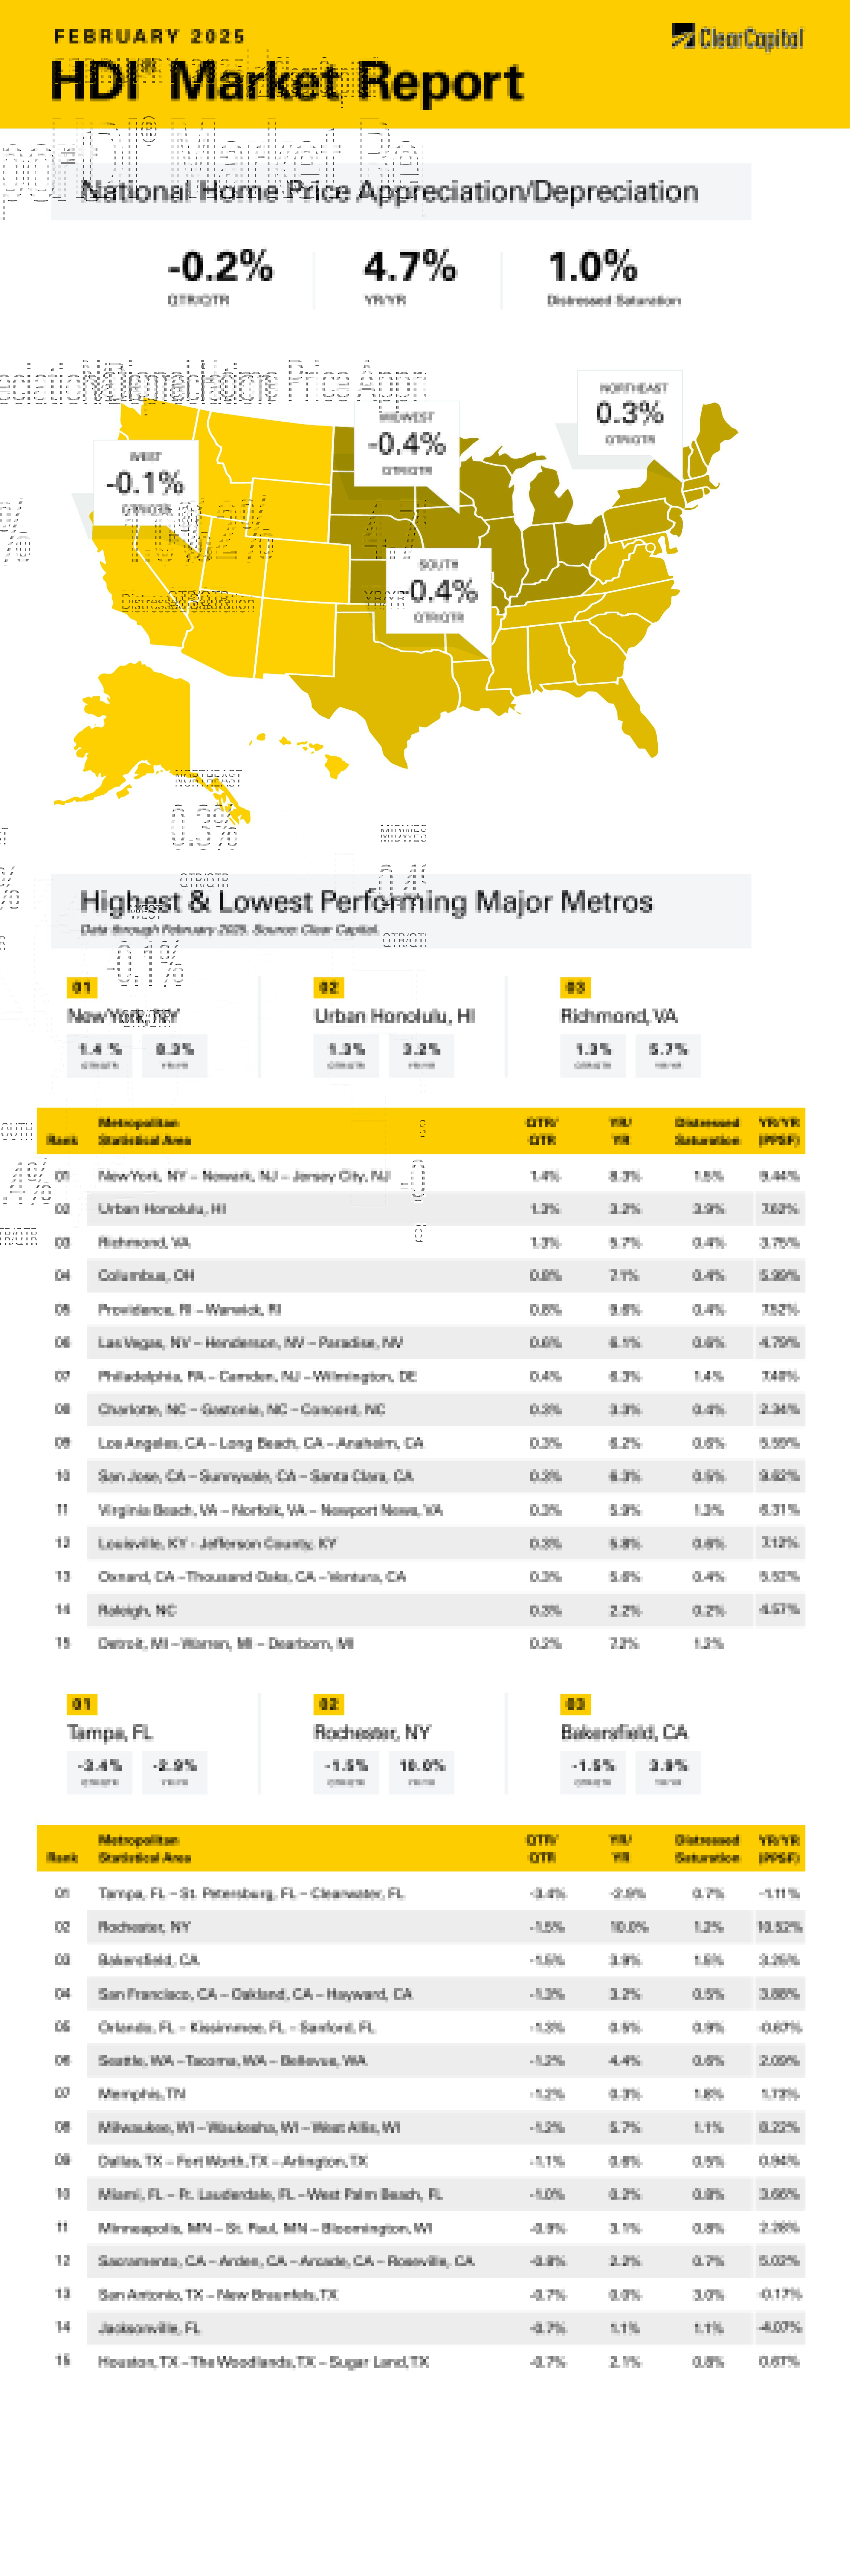
Home prices fell in March as the Clear Capital Home Data Index (HDI®) declined 0.2% quarter-over-quarter (QoQ) and rose 4.7% on a year-over-year (YoY) basis. Quarterly price appreciation fell in the west, south and midwest and rose in the northeast. On a YoY basis, all regions rose.
The fastest growing region was the northeast, which grew 0.3% QoQ and 7.1% on an annual basis. Providence was the leader, with prices rising 9.6% on an annual basis. Other notable northeastern MSAs include the New York City metropolitan area, where prices increased 8.3% YoY, and Philadelphia, where prices increased 6.3%. In Rochester, prices fell 1.5% quarterly but were still up 10% annually.
The next-best region was the west where prices fell 0.1% QoQ and rose 4% YoY. Urban Honolulu exhibited 1.3% quarterly growth and rose 3.2% YoY. Las Vegas saw prices rise 0.6% on a quarterly basis and 6.1% on an annual basis. San Jose, CA and Los Angeles saw prices rise 0.3% quarterly and 6.3% and 6.2% annually, respectively. Bakersfield and San Francisco MSAs showed quarterly decreases of 1.5% and 1.3% respectively.
The midwest saw prices fall 0.4% on a quarterly basis and rise 6.2% annually. Columbus, OH was the leader with 0.8% quarterly growth, followed by Detroit with 0.2% quarterly growth. The only notable weakness in the midwest was Milwaukee, where prices fell 1.2% on a quarterly basis.
Prices in the south fell 0.4% on a quarterly basis and only rose 2.7% on an annual basis. Richmond, VA and Charlotte, NC were pockets of strength, while Tampa, FL struggled, posting a 3.4% quarterly decline and a 2.9% annual loss. Florida’s condo laws have created a buyer’s market with lots of properties on the market. While some of these properties might look cheap compared to the comps, they may require $50,000 assessments to bring the building up to code. They are cheap for a reason.
The Fed’s fight against inflation is in the final innings, and one of the last pieces of the puzzle has been shelter inflation. Shelter inflation is driven by asking rents and home price indices. Below is a chart of the shelter component of the Consumer Price Index on a YoY basis.
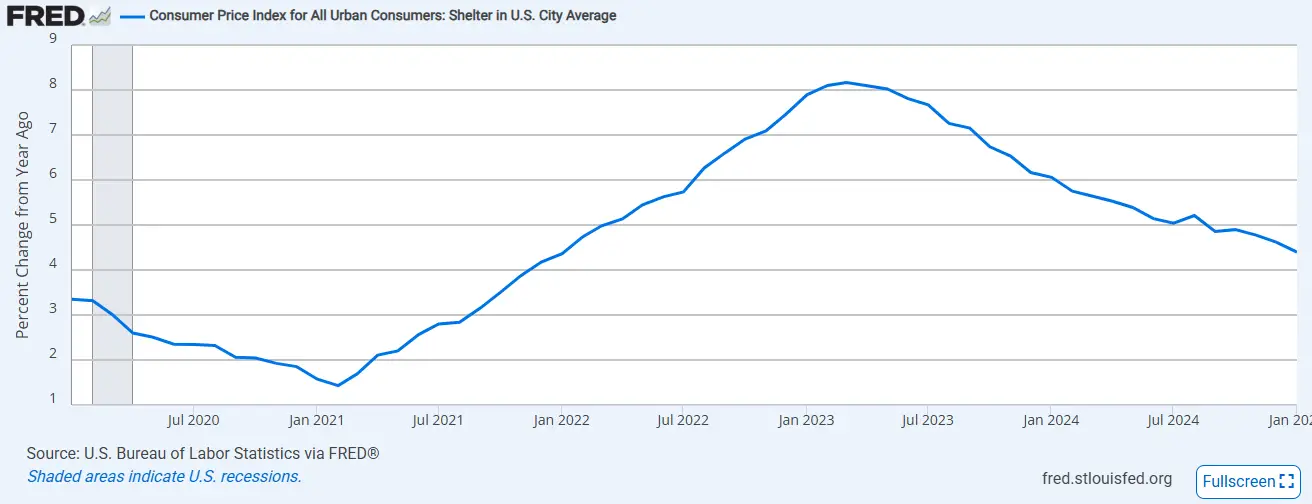
Prior to the pandemic, shelter inflation was 3.4%. When the Fed cut rates to zero and began aggressively buying mortgage-backed securities, mortgage rates fell into the low 3% range, and the US entered the classic asset inflation scenario: too much money chasing too few assets. Shelter inflation generally lags home prices; while price appreciation peaked in March of 2022, shelter inflation didn’t peak until a year later. This is largely due to the delay in negotiating new rents. Shelter inflation peaked at 8.2% annually and has subsequently fallen to 4.4%. In other words, shelter inflation has recovered about 80% of its pandemic rise, which means the heavy lifting on inflation is largely done.
Tariffs and a drop in consumer spending (along with some weakness in manufacturing) have caused the Atlanta Fed’s GDP Now Model to predict a 2.8% contraction in GDP for the first quarter. A month ago, the model saw 3.9% growth, so this is a gargantuan swing. Consumer spending in January fell about 2 tenths of a percent due to weakness in auto sales. Given that auto sales are quite volatile, the model is probably overfitting a bit and we aren’t looking at an imminent recession. Still, the weakness has been enough to move the Fed Funds futures which now see 75 basis points in rate cuts this year as the most likely scenario, up from 25 about a month ago. The Fed is still in inflation-fighting mode but does not want to see unemployment rise above its current 4% level.
The Fed’s posture is still contractionary. The Fed uses the term r* (or r-star) to denote the neutral rate of interest, where monetary policy is neither expansionary nor contractionary. There is no way to measure r-star directly, so it is a bit of a moving target. That said, the Fed Governors’ forecast of long- term rates varies between 2.8% and 3.6%, so rates need to fall about 100 basis points just to get to neutral. If the economy weakens, the Fed will need to catch up quickly and would have to cut rates below r-star if the economy enters a recession.
If the Fed does begin cutting rates, will it re-ignite inflation? Probably not. We won’t have the supply chain shocks of the pandemic years, nor will the Fed be buying mortgage-backed securities. Real estate prices are declining on a quarter-over-quarter basis, and annual increases are in the mid-single digits. Inventory is increasing, and house prices are up against affordability constraints.
Falling mortgage rates will ease the way for more transactions, as affordability improves, and the rate lock-in effect dissipates. The overbuilt MSAs in the Sun Belt may struggle a bit, while some of the places that have seen little building since the Great Recession will see continued demand.
Bottom line: shelter inflation moves slowly, and the Fed can probably continue to cut rates without re-igniting inflation. If the labor market begins to weaken, the Fed will get to r-star in a hurry, which means 2025 might be a better year for housing than people expect.
About the Clear Capital Home Data Index (HDI®) Market Report and Forecast
The Clear Capital HDI Market Report and Forecast provides insights into market trends and other leading indices for the real estate market at the national and local levels. A critical difference in the value of Clear Capital’s HDI Market Report and Forecast is the capability to provide more timely and granular reporting than nearly any other home price index provider.
Clear Capital’s HDI Methodology
• Generates the timeliest indices in patent pending, rolling quarter intervals that compare the most recent four months to the previous three months. The rolling quarters have no fixed start date and can be used to generate indices as data flows in, significantly reducing multi-month lag time that may be experienced with other indices.
• Includes both fair market and institutional (real estate owned) transactions, giving equal weight to all market transactions and identifying price tiers at a market specific level. By giving equal weight to all transactions, the HDI is truly representative of each unique market.
• Results from an address-level cascade create an index with the most granular, statistically significant market area available.
• Provides weighted repeat sales and price-per-square-foot index models that use multiple sale types, including single-family homes, multi-family homes and condominiums.
The information contained in this report and forecast is based on sources that are deemed to be reliable; however, no representation or warranty is made as to the accuracy, completeness, or fitness for any particular purpose of any information contained herein. This report is not intended as investment advice, and should not be viewed as any guarantee of value, condition, or other attribute.