

The August 2022 Home Data Index™ (HDI™) Market Report shows national quarter-over-quarter (QoQ) home price growth is at 7.4 percent.
Download the report, or read it below.
Commentary by Brent Nyitray of The Daily Tearsheet
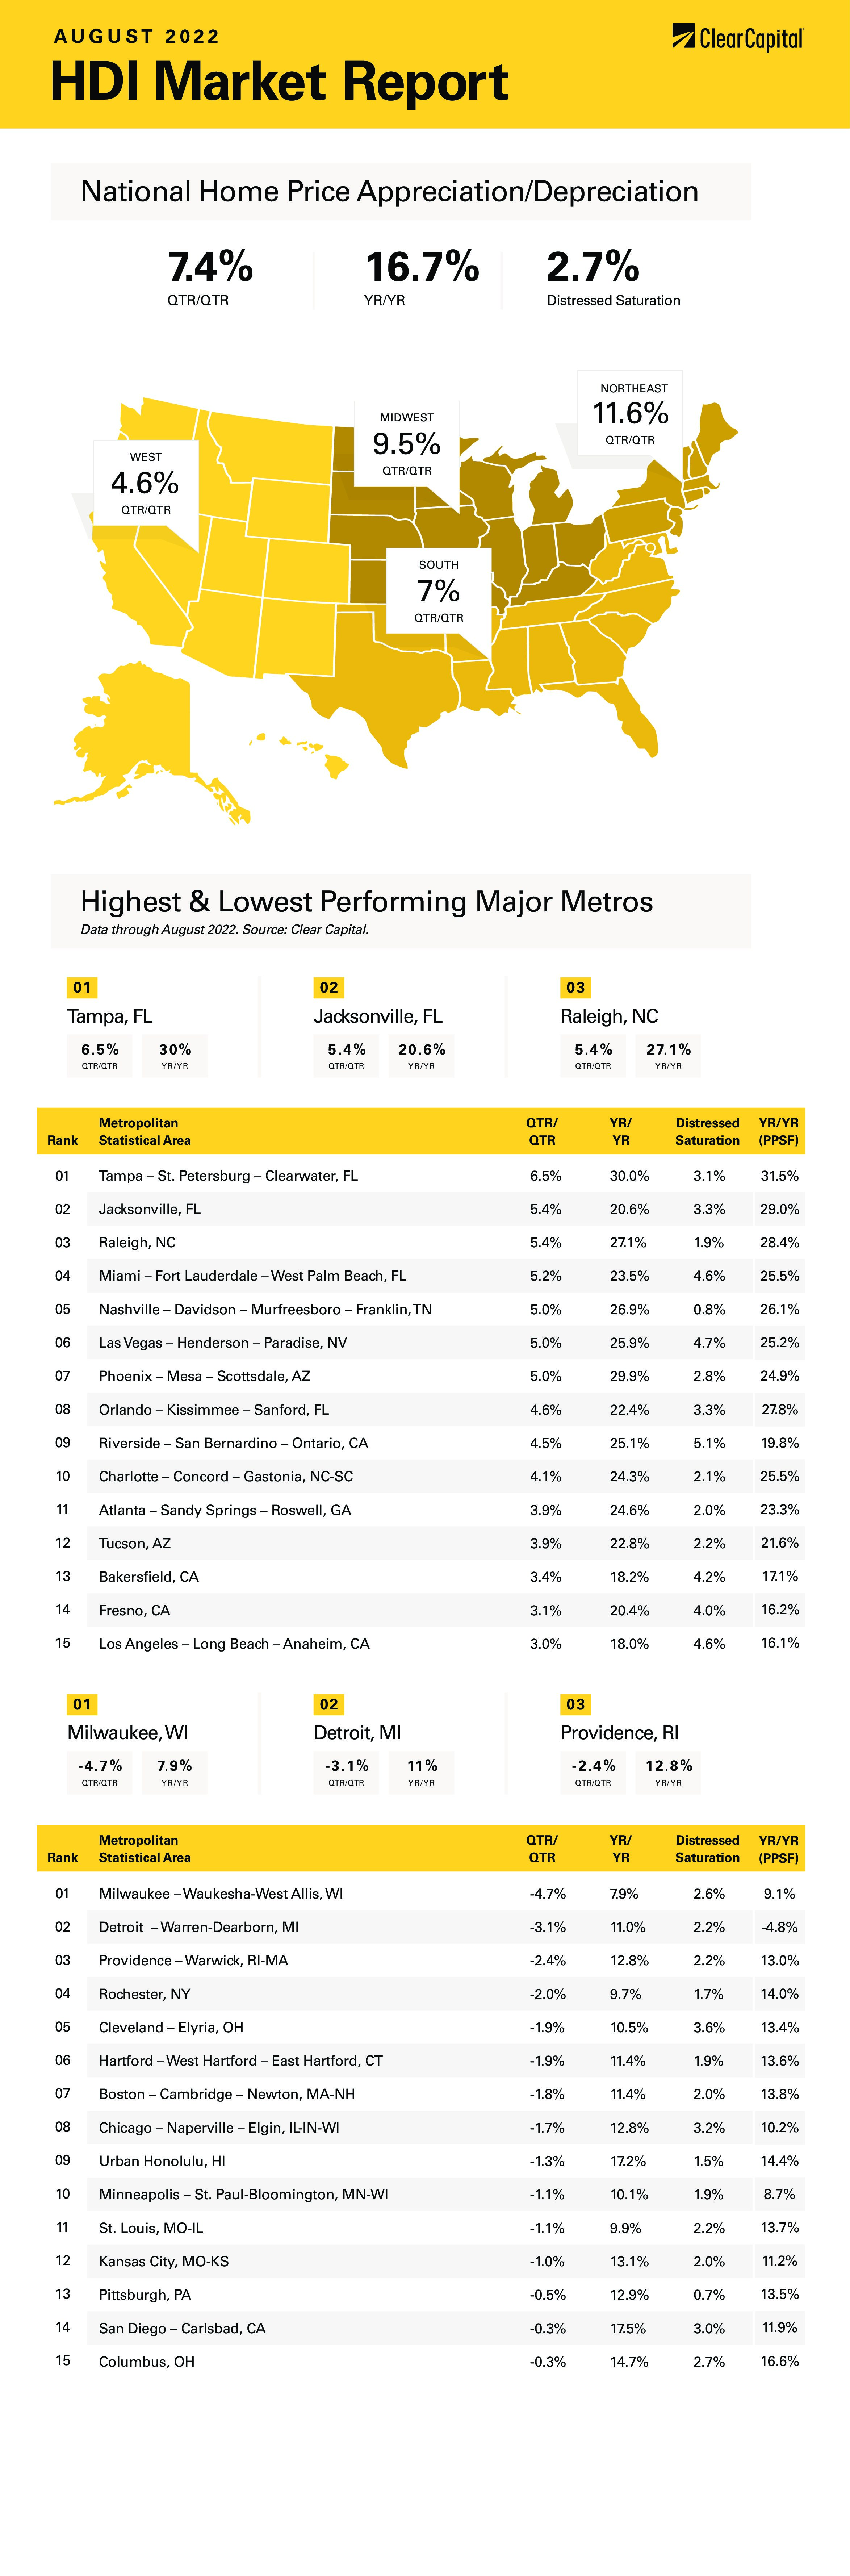
Home price appreciation cooled markedly in August as the Clear Capital Home Data Index rose 7.4% quarter-over-quarter (QoQ) and 16.7% on a year-over-year (YoY) basis. This compares to an 11% QoQ increase and a 20% YoY increase in July. Every region reported home price appreciation, and some of the hottest regions remain in Florida.
Interestingly, the Northeast had the fastest quarterly growth at 11.6% and the fastest annual growth at 20.2%. However, no Northeast MSAs made the top 15. In fact, some of the lowest performers were in the Northeast, such as Hartford, Providence, and Boston. The Northeast has been a national laggard since the real estate bubble burst in 2006, which has been at least partially driven by declining employment in the financial sector.
The South came in second, which grew 19.4% last month. Most of the top 15 MSAs were in the South, with Tampa rising 30%, Raleigh and Nashville rising 27%, and Atlanta increasing 25%. The South has been a stalwart performer over the past several quarters.
The West came in next, where prices rose 15.2% on a YoY basis. Phoenix remained strong, with 30% home price appreciation, followed by Las Vegas with 26% growth. Interestingly, we saw some home price decreases in San Diego, however prices are still up 18% YoY.
Finally, the Midwest saw a 10.8% increase in prices. After making the top 15 last month, Milwaukee ended up showing the slowest quarterly increase, where prices fell 4.7% and only rose 8% YoY. No Midwest MSAs made the top 15 this time around, and we saw quarterly decreases in Detroit, Cleveland, Chicago, and St. Louis.
The term “housing recession” has suddenly emerged as the new topic of conversation in the business press. Almost every statistic, save for home price appreciation, has been trending negative for some time. Housing starts remain at about the same level they were 70 years ago, while home sales are declining at an alarming rate. According to the National Association of Realtors, existing home sales fell 6% MOM and 20% YoY. New Home Sales are even worse – the latest data has new home sales down 13% MOM and 30% YoY. The S&P 500 Homebuilder ETF (XHB) has underperformed the S&P 500 by 12% year-to-date.
The consensus is becoming bearish on house prices given the rapid increase in home prices and mortgage rates. And in some hot MSAs, it wouldn’t be unreasonable to see a decrease after years of torrid growth. Could we see another crisis like we had in the mid-00s? Institutional money is beginning to put a pause on purchases.
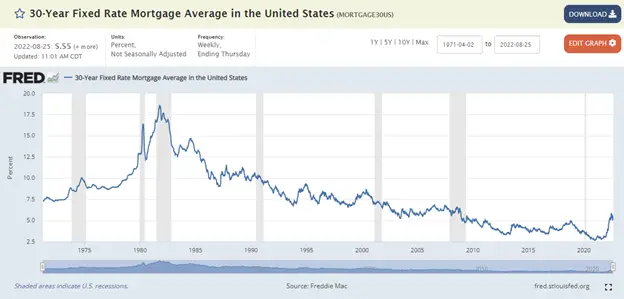
The chances of another nationwide decline seem pretty remote, unless we have a major economic shock accompanies by much higher interest rates. While mortgage rates are high compared to the past few years, the overall mortgage rate is still quite low on a historical basis. Older Americans might remember paying 18% on a mortgage in the early 1980s. Plus, any sort of economic shock would almost certainly end the Fed’s tightening cycle, which takes rising mortgage rates out of the picture.
While mortgage rates and home prices affect affordability, so do wages, and those are catching up. We have one of the strongest labor markets in history right now, and rising wages will do a lot to ease the affordability issue. Encouragingly, the latest inflation indices show month-over-month inflation is close to 0%. This is an indication that the trend is flipping. The latest University of Michigan Consumer Sentiment index showed that inflationary expectations are the lowest in 8 months. Numbers like this will permit the Fed to go slower on future rate increases.
The most expensive markets may be vulnerable to a correction simply because the new normal of remote work means that many workers will move to cheaper locations. This probably explains why the South is benefiting so much from people fleeing the Northeast, while places like Phoenix, Las Vegas, and the Mountain states are benefiting from people leaving California.
One possible black swan for the West Coast could be the implosion of the Chinese real estate bubble. Prices are beginning to decline, and we are seeing financial stress in the banking system and amongst developers. As a general rule, during periods like this, people sell what they can, not necessarily what they want to. And trophy properties in Vancouver, San Francisco, and Seattle could be let go to raise capital.
In the US, I suspect any decrease in prices would be mild given that the credit quality of mortgages today is a night and day difference from 2006. Investors are putting up at least 25% when taking out a mortgage, which pretty much takes the strategic default issue out of the equation. After a long period of rising prices, a breather in home price appreciation (which will happen due to seasonality anyway) won’t be the end of the world.
About the Clear Capital Home Data Index™ (HDI™) Market Report and Forecast
The Clear Capital HDI Market Report and Forecast provides insights into market trends and other leading indices for the real estate market at the national and local levels. A critical difference in the value of Clear Capital’s HDI Market Report and Forecast is the capability to provide more timely and granular reporting than nearly any other home price index provider.
Clear Capital’s HDI Methodology
• Generates the timeliest indices in patent pending, rolling quarter intervals that compare the most recent four months to the previous three months. The rolling quarters have no fixed start date and can be used to generate indices as data flows in, significantly reducing multi-month lag time that may be experienced with other indices.
• Includes both fair market and institutional (real estate owned) transactions, giving equal weight to all market transactions and identifying price tiers at a market specific level. By giving equal weight to all transactions, the HDI is truly representative of each unique market.
• Results from an address-level cascade create an index with the most granular, statistically significant market area available.
• Provides weighted repeat sales and price-per-square-foot index models that use multiple sale types, including single-family homes, multi-family homes and condominiums.
The information contained in this report and forecast is based on sources that are deemed to be reliable; however, no representation or warranty is made as to the accuracy, completeness, or fitness for any particular purpose of any information contained herein. This report is not intended as investment advice, and should not be viewed as any guarantee of value, condition, or other attribute.