

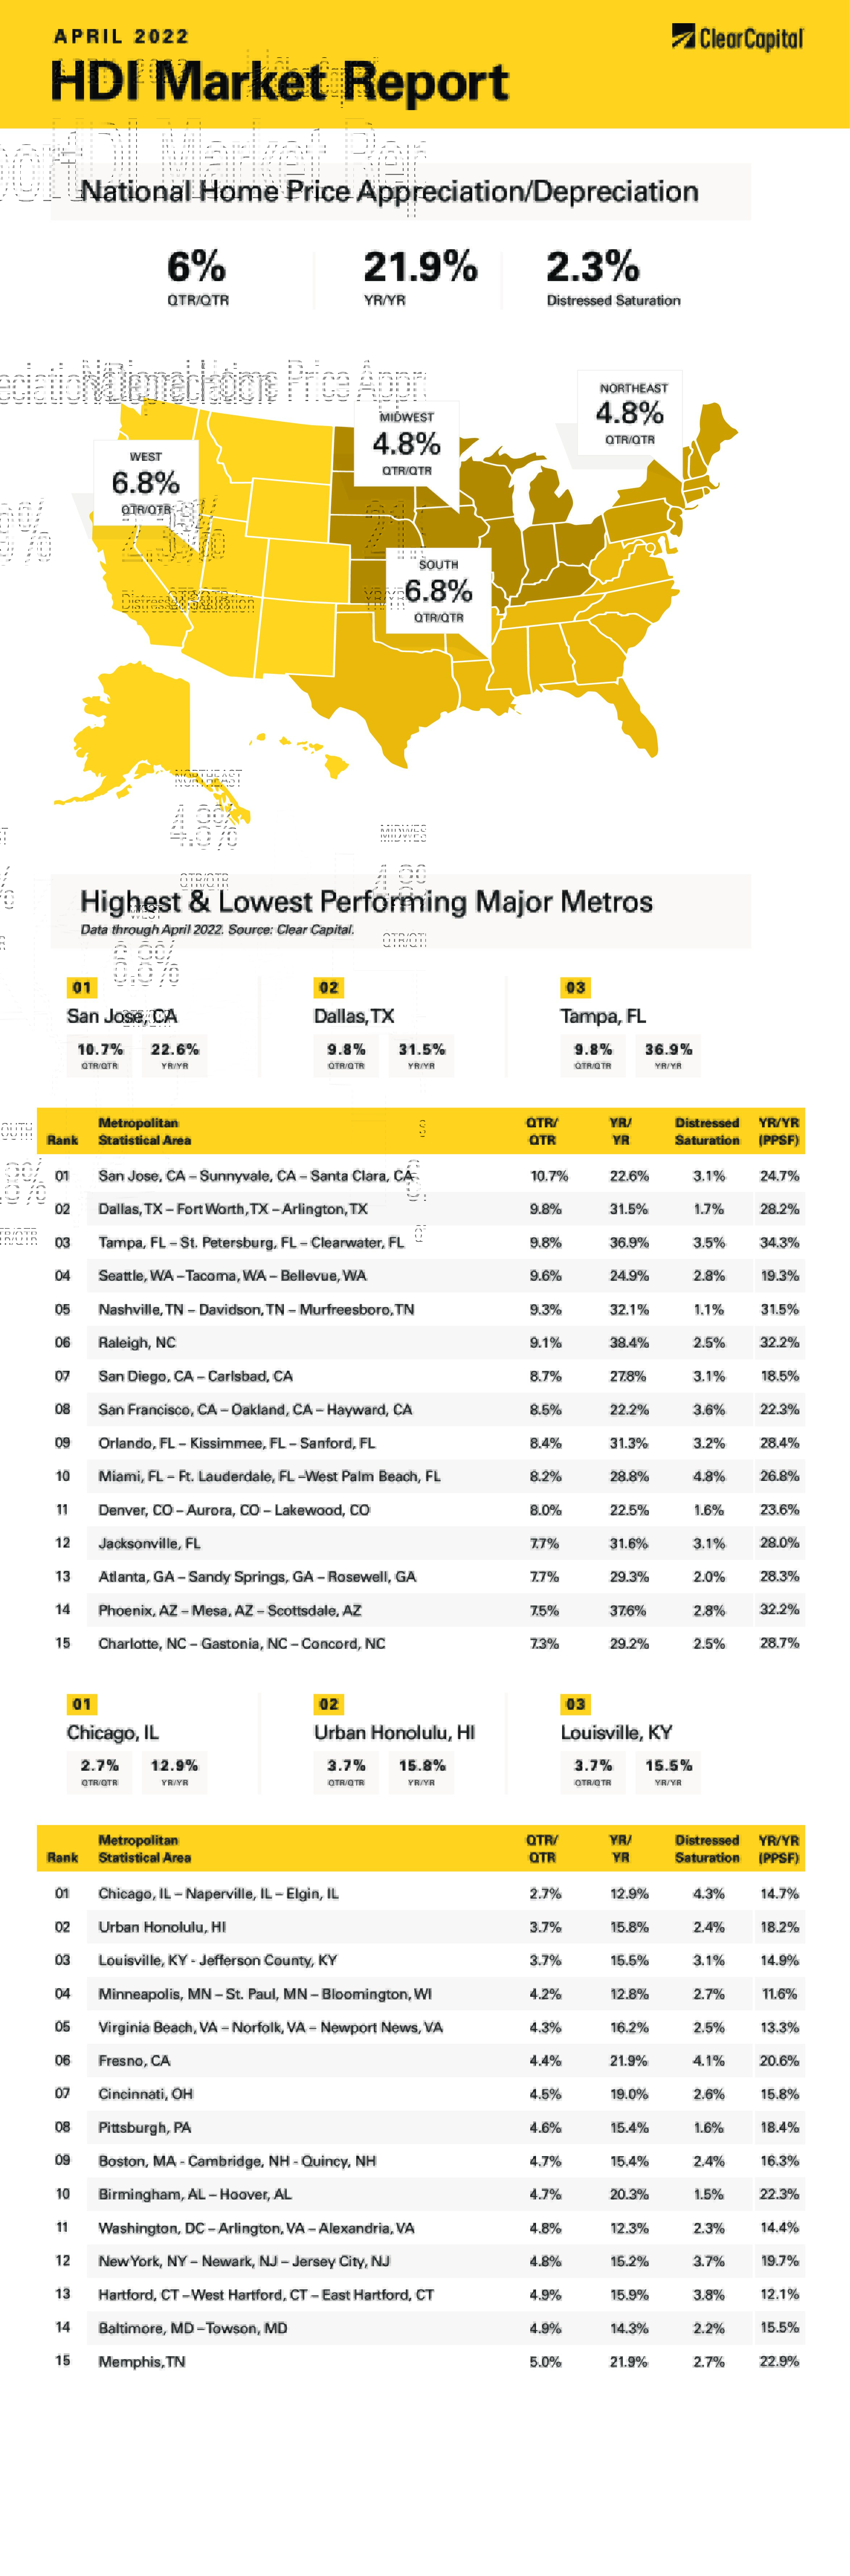
The April 2022 Home Data Index™ (HDI™) Market Report shows national quarter-over-quarter (QoQ) home price growth is at 6 percent.
Download the report, or read it below.
Commentary by Brent Nyitray of The Daily Tearsheet
Home price appreciation accelerated in April as the Clear Capital Home Data Index rose 6% quarter-over-quarter (QoQ) and 21.9% on a year-over-year (YoY) basis. This was a pickup from the February pace of 3.9% QoQ and 20.3% YoY. Every region reported home price appreciation, and some of the hottest markets on the West Coast are accelerating again.
The fastest growing region was the South, which grew 25.4% last month. Raleigh was the leader, with prices rising 38%. Other notable Southern MSAs include Tampa, where prices rose 37% and Nashville, where they rose 32%.
The West came in second at 24.7%, with the usual suspects showing the most growth. The leader was Phoenix, where price rose 38% and San Diego where prices rose 28%. The Bay Area is accelerating, and prices rose 23% in the San Jose area.
The Midwest came in next, where prices rose 17.5% on a YoY basis. No Midwest MSAs made it into the top 15, however some of the laggards were there, including Chicago (up 13%) and Minneapolis (up 13%). In Cincinnati, prices rose 19% as well.
Finally, the Northeast saw a 17.2% increase in prices. No Northeastern MSAs made the top 15. Other notable Northeastern MSAs include New York City area, where prices rose 15.2% and Boston where they rose 15.4%.
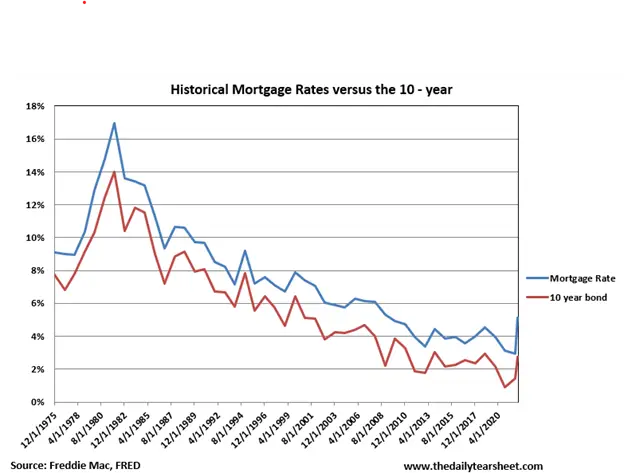
Between rising home prices and mortgage rates, housing affordability has taken a hit. The 30-year fixed rate mortgage has increased 2 percentage points year to date, rising to 5.11%. This has caused many in government to fret about housing affordability. Housing affordability has certainly been negatively affected compared to recent history, however it is always helpful to get a historical perspective.
The 10-year bond yield is approaching 3%, which is back to levels last seen during the 2013 “taper tantrum.” The 30-year mortgage rate is above 5%, which is where it was in the aftermath of the real estate bubble. Interest rates are clearly the highest they have been in a while.
That said, when you look the past 40 years or so, rates are still quite low. Back in the 1980s, borrowers could expect to pay 17% for a mortgage. Back then the first few years of payments were almost entirely interest, and meaningful principal paydown didn’t occur until about 5 years after the loan was made. Borrowers who had to sell within the first couple of years would be lucky to make enough on the home to cover closing costs.
Below is a chart of the 10-year bond yield and the 30-year mortgage rate going back to 1975. Interest rate cycles are long and gradual, and by historical standards still quite low.
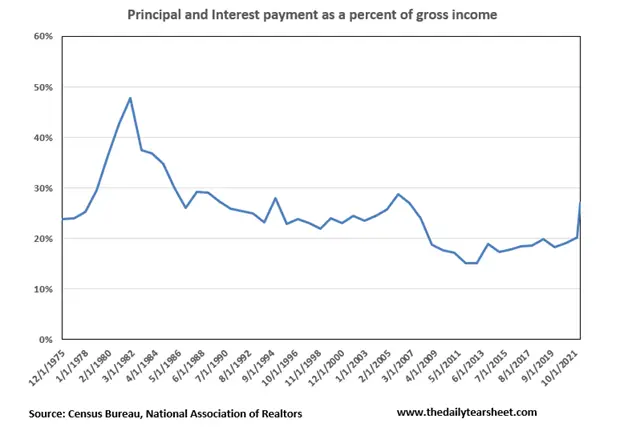
Interest rates are probably the biggest driver of affordability, mattering more than home prices or incomes. To demonstrate this, I looked at median incomes, median home prices, and mortgage rates going back to 1975. I calculated the principal and interest payment for the median home, assuming the borrower put down 20%. I then divided that payment by median income and plotted that percentage of incomes over time.
At the end of 2021, the median household income in the US was about $70,000 and the median home price according to the National Association of Realtors was $346,900. The 30-year fixed rate mortgage was 2.96%. The principal and interest for a year would be roughly $14,000, which is about 20% of income. Fast-forward 3 months, with a median home price of $363,100 and mortgage rates of 5%, that principal and interest payment is now roughly $18,900, which is a 35% increase from the beginning of the year. Incomes are increasing at about 1.5% per quarter, so if we look at the new percentage, it works out to be 26.6%, which is a massive increase in a short 3 months.
What does that look like historically? It turns out to be just above average. From 1975 to 2021, the median mortgage payment (principal and interest) on the median house took up about a quarter of the typical borrower’s median income. In the early 80s, it was pushing 50%. We are still below the highs we saw during the bubble years, and more or less where we were in the 1990s. You can see the history in the chart below:
Given this data, along with the abject shortage of housing in the United States, it is hard to see home price appreciation reversing even with the big decline in affordability. In fact, I suspect that the wild card in affordability will be wage growth, which appears to be accelerating especially for lower-to-median income workers. I suspect fears of an affordability-driven decline in home prices are overblown.
About the Clear Capital Home Data Index™ (HDI™) Market Report and Forecast
The Clear Capital HDI Market Report and Forecast provides insights into market trends and other leading indices for the real estate market at the national and local levels. A critical difference in the value of Clear Capital’s HDI Market Report and Forecast is the capability to provide more timely and granular reporting than nearly any other home price index provider.
Clear Capital’s HDI Methodology
• Generates the timeliest indices in patent pending, rolling quarter intervals that compare the most recent four months to the previous three months. The rolling quarters have no fixed start date and can be used to generate indices as data flows in, significantly reducing multi-month lag time that may be experienced with other indices.
• Includes both fair market and institutional (real estate owned) transactions, giving equal weight to all market transactions and identifying price tiers at a market specific level. By giving equal weight to all transactions, the HDI is truly representative of each unique market.
• Results from an address-level cascade create an index with the most granular, statistically significant market area available.
• Provides weighted repeat sales and price-per-square-foot index models that use multiple sale types, including single-family homes, multi-family homes and condominiums.
The information contained in this report and forecast is based on sources that are deemed to be reliable; however, no representation or warranty is made as to the accuracy, completeness, or fitness for any particular purpose of any information contained herein. This report is not intended as investment advice, and should not be viewed as any guarantee of value, condition, or other attribute.