

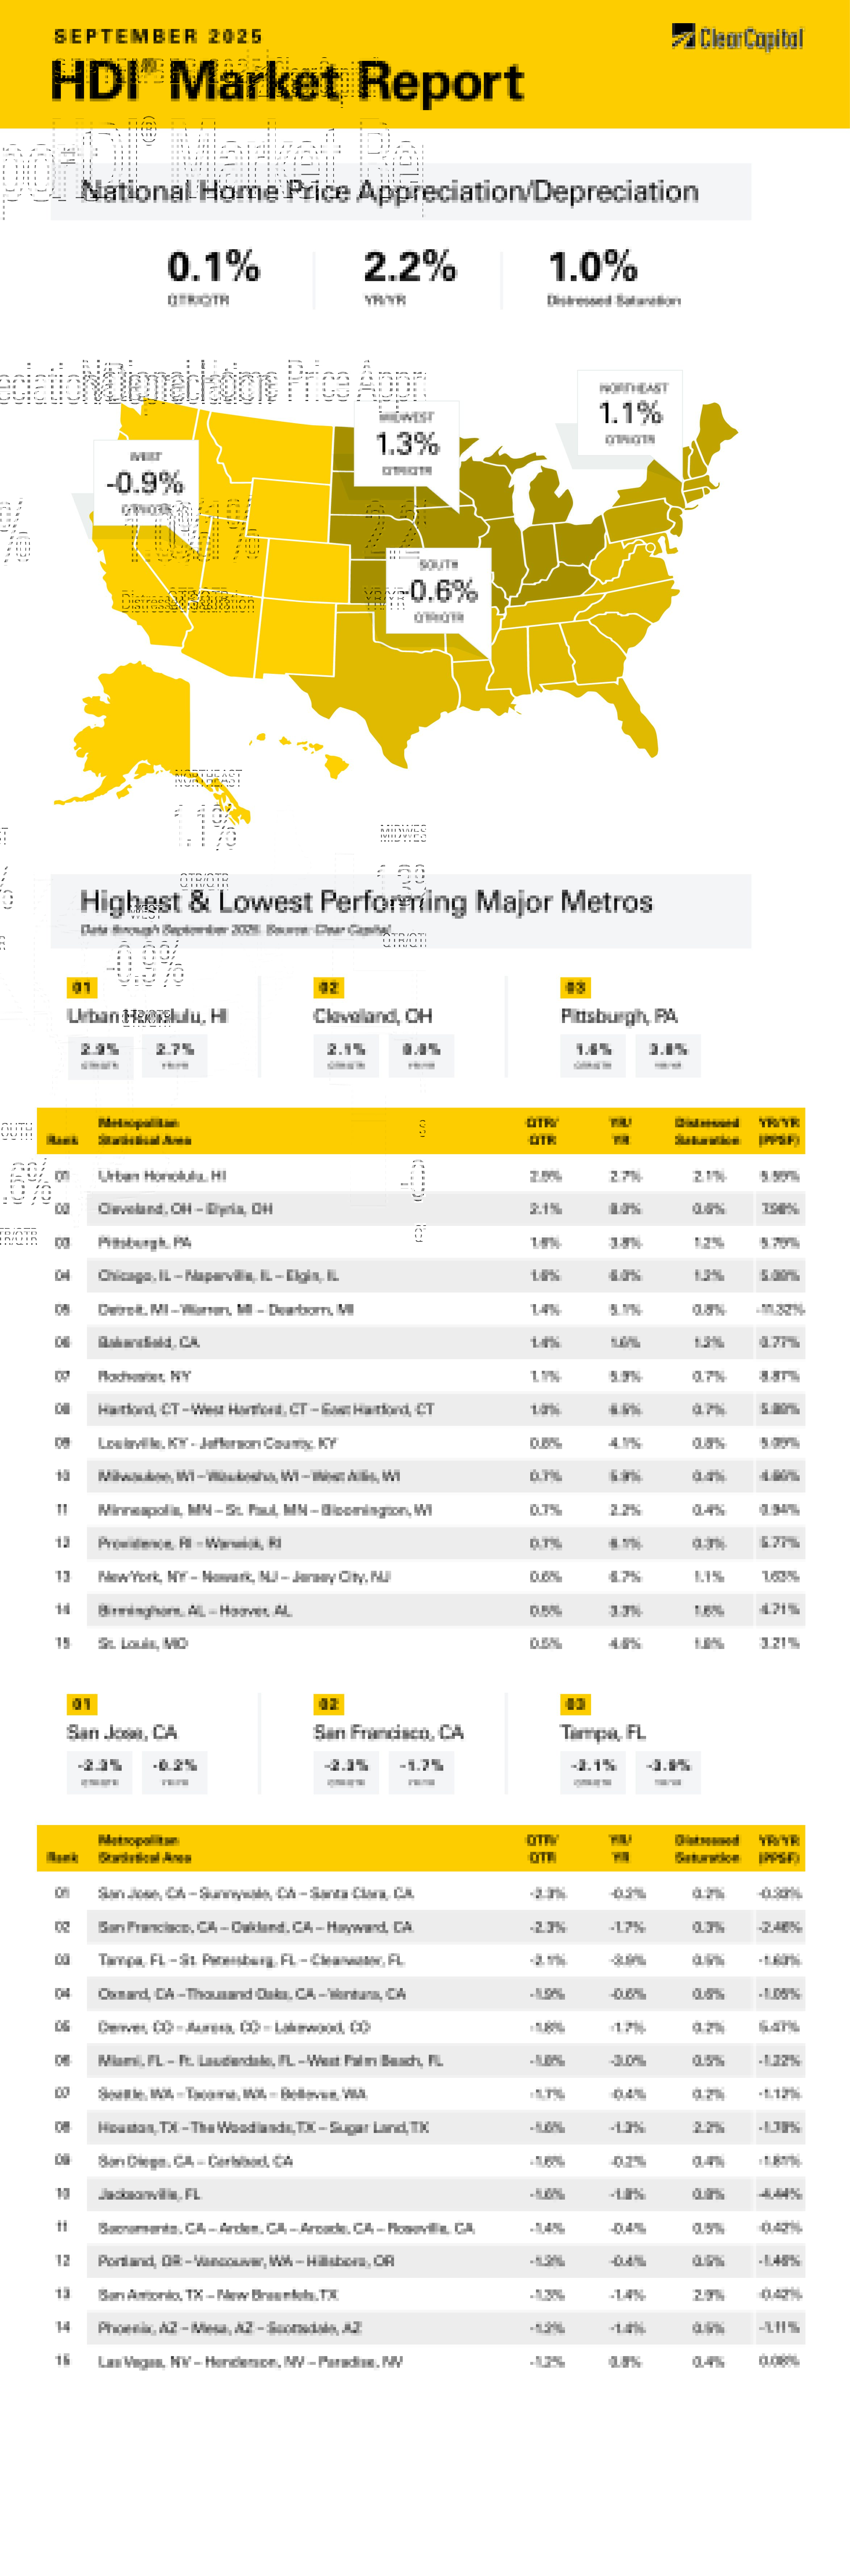
The September 2025 Clear Capital Home Data Index (HDI®) Market Report shows national quarter-over-quarter home price growth is at 0.1 percent.
Download the report, or read it below.
Commentary by Brent Nyitray of The Daily Tearsheet
Home price appreciation continued to slow in September, according to the Clear Capital Home Data Index. National home prices rose just 0.1% on a quarterly basis and 2.2% annually. The Northeast and the Midwest continue to outperform, while the West and the South lag behind the rest of the U.S.
The Midwest was the top performer, rising 1.3% on a quarterly basis and 4.6% annually. Cleveland, OH was the top performer, with prices increasing 2.1% on a quarterly basis and 8.0% on an annual basis. The next best was Chicago, where prices rose 1.6% on a quarterly basis and 6.0% on an annual basis. Detroit was a top performer as well, with prices rising 1.4% on a quarterly basis and 5.1% on an annual basis.
The Northeast was the next best market, rising 1.1% quarterly and 5.6% annually. The top Northeastern Metropolitan Statistical Area (MSA) was once again Rochester, where prices grew 1.1% on a quarterly basis and 5.9% annually. The New York City area saw strong growth, rising 0.6% on a quarterly basis and 6.7% annually. Hartford, CT also performed well, rising 1.0% quarterly and 6.5% on an annual basis.
The South came in third, where prices fell 0.6% on a quarterly basis and rose 0.4% on an annual basis. Birmingham, AL was the top performer, with prices rising 0.5% on a quarterly basis and 3.3% annually. Tampa was one of the worst performing MSAs in the South, with prices falling 2.1% quarterly and 3.9% annually. Miami also struggled with prices falling 1.8% on a quarterly basis and 3.0% annually.
The West came in last, where prices fell 0.9% on a quarterly basis and rose only 0.2% annually. The only Western MSA to hit the top 15 was Honolulu, where prices rose 2.9% quarterly and 2.7% annually. The worst performing MSA was San Jose where prices fell 2.3% on a quarterly basis and 0.2% on an annual basis. San Francisco also struggled, with prices falling 2.3% on a quarterly basis and 1.7% on an annual basis.
Home price appreciation has been slowing for months and has turned negative in a lot of the erstwhile hottest markets in the US, particularly in Florida and the West Coast. Florida saw a huge influx of people escaping the cities during the COVID pandemic leading to bidding wars. Real estate prices and insurance costs have increased enough that Florida is no longer cheap. Price cuts are now becoming the norm as we enter the seasonally slow period for the residential real estate market. Inventory is piling up, and according to one study, sellers outnumber buyers by half a million, which is the highest level going back 10 years.
Weakness in the condo market has been replaced by softness in the single-family market. Many condos have already seen their price cuts, given the huge maintenance bills required to bring many of these properties back up to code. Now this activity is spreading to single-family detached. This weakness has led some prognosticators to ask whether we are in another real estate bubble and whether we will see price decreases like 2008.
A wholesale decline in real estate prices is highly unlikely for several reasons. First, the declines so far seem to be concentrated in areas which saw tremendous growth in the aftermath of the residential real estate bubble and were boosted during the COVID pandemic. The Midwest and the Northeast simply did not experience the post-bust rebound the way the West did. They, therefore, don’t have the same affordability problems, and don’t seem ripe for a big sell-off. If anything, the population may be moving back to these MSAs since they have become too cheap to ignore.
Second, much of the selling in the 2008 market was forced selling from holders of mortgage-backed securities who were losing money on their securities. Today, the vast majority of the mortgage-backed securities in the US are backed by the government, either directly via Ginnie Mae or indirectly through Fannie Mae and Freddie Mac. With a government-guaranteed return, the securities will not decline enough in value to margin calls and forced liquidation. The loans in these portfolios were underwritten to much stricter standards compared to the bubble years, and there is much more equity in these loans. Real estate bubbles are extremely rare events, and only occur when everyone (buyers, regulators, lenders) all believe an asset is “special” and cannot fall in price. The 2008 bust is still too fresh in our memories for another one to occur. That said, we probably will see continued weakness in Florida and the Sun Belt, but nothing nationwide.
The Fed may come to the rescue as well. Since inflation began in 2021, shelter inflation was the big driver. Even in the most recent inflation data — shelter, not tariffs, is the biggest component to inflation. Shelter inflation tends to move slowly and exhibit lagged behavior. In other words, the recent moderation in home price appreciation won’t start showing up in CPI inflation until next year.
Shelter inflation has almost returned to pre-pandemic levels.
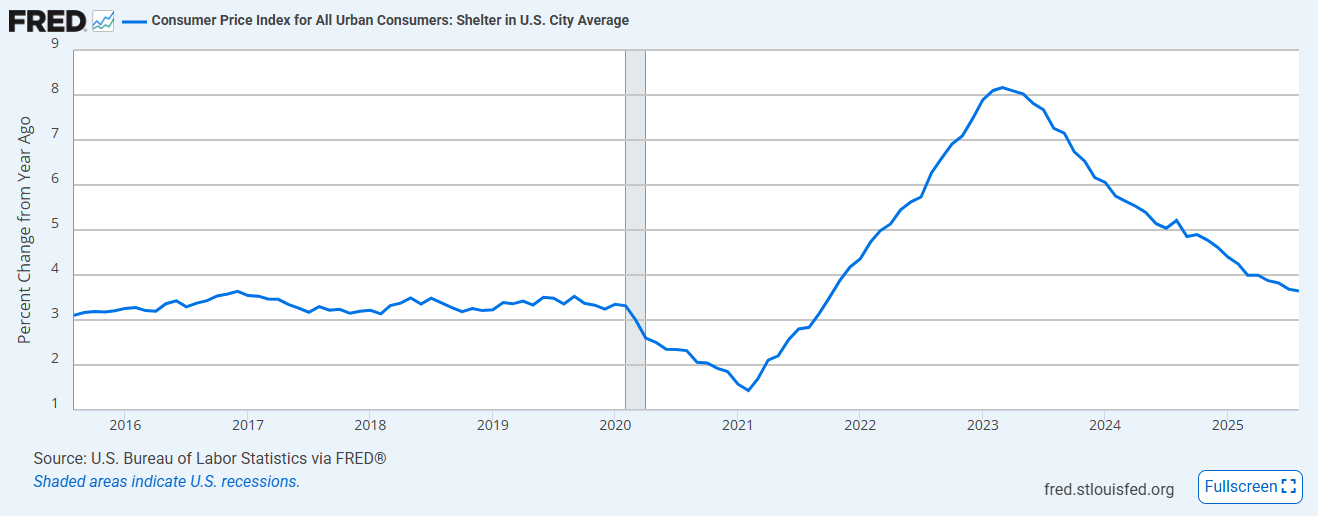
Since price appreciation is still falling and asking rents have been stagnant for years, shelter inflation will probably not simply return to pre-pandemic levels – it will continue to decline and could eventually become a drag on inflation. The labor market is weakening as well, and so far we aren’t seeing widespread tariff-driven inflation. The Fed may be closer to hitting its 2% target than it thinks, especially if shelter inflation drops below 3%. Lower interest rates will in turn support the residential real estate market and hopefully encourage more home construction, which is desperately needed.
About the Clear Capital Home Data Index (HDI®) Market Report and Forecast
The Clear Capital HDI Market Report and Forecast provides insights into market trends and other leading indices for the real estate market at the national and local levels. A critical difference in the value of Clear Capital’s HDI Market Report and Forecast is the capability to provide more timely and granular reporting than nearly any other home price index provider.
Clear Capital’s HDI Methodology
• Generates the timeliest indices in patent pending, rolling quarter intervals that compare the most recent four months to the previous three months. The rolling quarters have no fixed start date and can be used to generate indices as data flows in, significantly reducing multi-month lag time that may be experienced with other indices.
• Includes both fair market and institutional (real estate owned) transactions, giving equal weight to all market transactions and identifying price tiers at a market specific level. By giving equal weight to all transactions, the HDI is truly representative of each unique market.
• Results from an address-level cascade create an index with the most granular, statistically significant market area available.
• Provides weighted repeat sales and price-per-square-foot index models that use multiple sale types, including single-family homes, multi-family homes and condominiums.
The information contained in this report and forecast is based on sources that are deemed to be reliable; however, no representation or warranty is made as to the accuracy, completeness, or fitness for any particular purpose of any information contained herein. This report is not intended as investment advice, and should not be viewed as any guarantee of value, condition, or other attribute.