

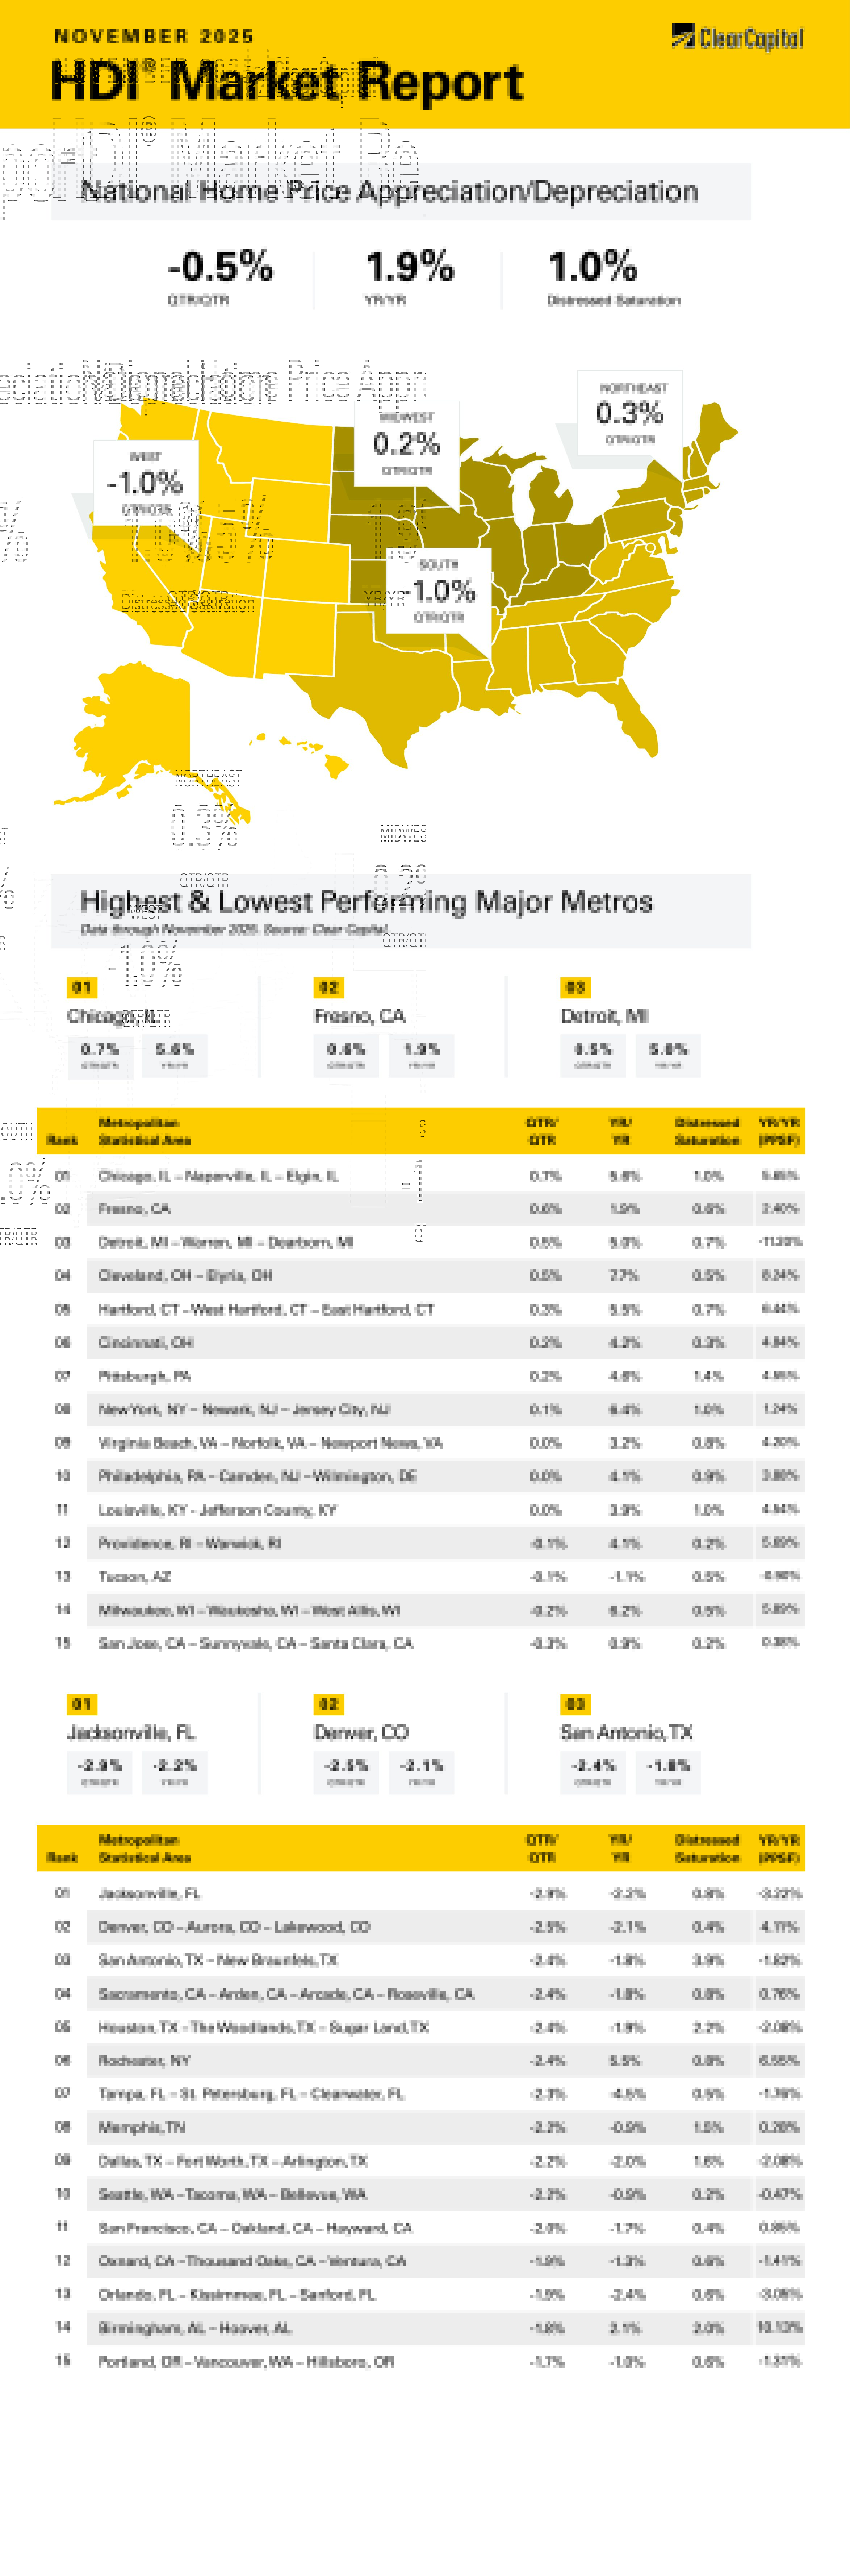
The November 2025 Clear Capital Home Data Index (HDI®) Market Report shows national quarter-over-quarter home price growth is at -0.5 percent.
Download the report, or read it below.
Commentary by Brent Nyitray of The Daily Tearsheet
Home price appreciation remained negative on a quarterly basis in November, according to the Clear Capital Home Data Index. Nationally, home prices fell 0.5% on a quarterly basis and rose 1.9% annually. The Northeast and the Midwest are still exhibiting quarterly and annual growth, while the West and the South are negative on a quarterly basis and have near-zero growth on a year-over-year (YoY) basis. Of the top 15 MSAs, eight experienced positive quarterly growth, three experienced no growth, and four had negative growth.
The Northeast was the top market, rising 0.3% quarterly and 5.2% annually. The top Northeastern metropolitan statistical area (MSA) was once again Hartford, CT, where prices grew 0.3% on a quarterly basis and 5.5% annually. The New York City MSA also saw growth, rising 0.1% on a quarterly basis and 6.4% annually. In Philadelphia, prices were flat on a quarterly basis and rose 4.1% annually. After being one of the leading Northeastern MSAs, Rochester, NY saw a quarterly decline of 2.4%, however annual price growth was still solid at 5.5%.
The Midwest was the next-best performer on a quarterly basis, rising 0.2% and 4.3% annually. Chicago was the top performer, with prices increasing 0.7% on a quarterly basis and 5.6% on an annual basis. The Rust Belt continued its run with prices in Detroit rising 0.5% on a quarterly basis and 5.0% on an annual basis. Cleveland and Cincinnati also saw strong growth with 7.7% and 4.2% annual increases respectively.
The South came in third, where prices fell 1.0% on a quarterly basis and rose 0.2% on an annual basis. Virginia Beach was the top performer, with prices flat on a quarterly basis and up 3.2% annually. Tampa pricing fell 2.3% on a quarterly basis and a whopping 4.5% on an annual basis. Florida is struggling in general as prices in Jacksonville fell 2.9% quarterly and 2.2% annually. In San Antonio, TX, prices fell 2.4% on a quarterly basis and 1.8% annually.
The West came in last, where prices fell 1.0% on a quarterly basis and exhibited negative YOY growth of 0.1% The top Western MSA was Fresno, where prices rose 0.6% quarterly and 1.9% YOY. Tucson was also a top 15 MSA, with prices only falling 0.1% quarterly and 1.1% annually. The worst performing MSA was Denver where prices fell 2.5% on a quarterly basis and 2.1% on an annual basis. Sacramento also struggled, with prices falling 2.4% on a quarterly basis and 1.8% on an annual basis.
As home price appreciation continues to moderate, we are seeing more investors tap the brakes on new purchases. According to Redfin, investor purchases increased only 1% in the third quarter, and the share of investor purchases declined to 17%. This is still above pre-pandemic levels, but down sharply from 2022, when it peaked at around 22%. A combination of stagnant rents, elevated mortgage rates and high home prices are conspiring to cause a lot of business-purpose transactions to not pencil out.
Rental appreciation estimates vary from a 2.3% gain to a 1.7% decline. Regardless, the days of high single-digit rental growth are gone, and mortgage lenders are taking a closer look at debt service coverage ratios.
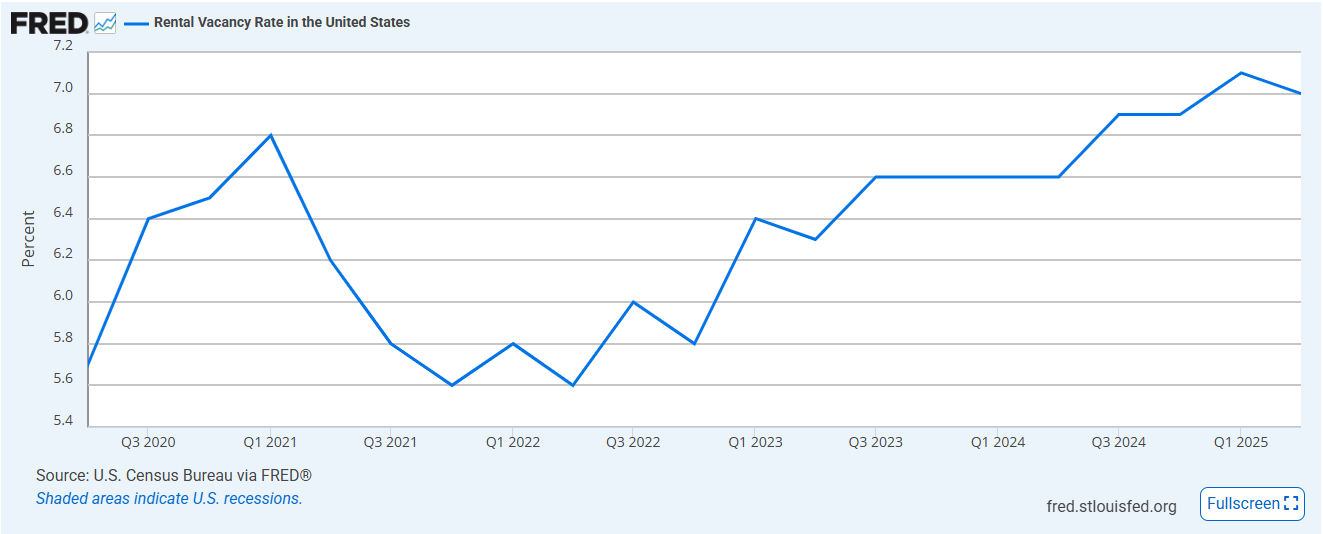
Rental vacancy rates are rising as well as the glut of apartments built from mid-2022 to mid-2023 hit the market. The lion’s share of the new supply has already been released, however there is still capacity being added. The vacancy rate hit 7% in the second quarter of 2025, which is up substantially from a few years ago.
At the same time, capital gains on real estate transactions are falling as home price appreciation moderates. Fix and flip investors used to rely on home price appreciation during the rehab period to cover taxes and bolster returns when the property was sold. Now, that tailwind has disappeared.
Rising vacancies, stagnant asking rents and falling home prices in many MSAs means that the risk of these transactions has increased. Typically, investors are required to put up substantial down payments, so we aren’t likely to see any distressed situations like we saw in the 2008-2010 downturn. Still, market participants are wary. We are also seeing buy-side investors take a much closer look at business purpose loans, especially when it comes to valuation.
Finally, the state of the economy remains a risk for real estate investors. Rising unemployment rates and less immigration means less demand for vacant units. Despite the recent lousy payroll additions and rising layoffs, the official unemployment rate remains low, which forces the Fed to maintain restrictive monetary policy. Usually when the economy weakens rates fall, but elevated inflation is preventing that from happening. So, real estate investors have the worst of both worlds.
Declining investor activity will certainly help the first-time homebuyer get their foot on the first rung of the property ladder. Given that homebuilding is still depressed, homebuyers will have to rely on wage growth to ease the affordability issue. This is already happening. In the latest ADP employment survey, job stayers received a 4.4% increase in wages while job changers reaped a 6.3% increase. This is outpacing the sub-2% home price appreciation we reported in our Home Data Index. This will help alleviate the affordability issue, however it will take years to fully play out.
Finally, we are seeing policy recommendations on how the government can address the affordability issue. At the local level, governments can address zoning issues and red tape associated with new construction. Some of the recommendations at the Federal level probably won’t do much (like the 50-year mortgage), but the issue has bipartisan interest as affordability remains the biggest pain point for voters.
About the Clear Capital Home Data Index (HDI®) Market Report and Forecast
The Clear Capital HDI Market Report and Forecast provides insights into market trends and other leading indices for the real estate market at the national and local levels. A critical difference in the value of Clear Capital’s HDI Market Report and Forecast is the capability to provide more timely and granular reporting than nearly any other home price index provider.
Clear Capital’s HDI Methodology
• Generates the timeliest indices in patent pending, rolling quarter intervals that compare the most recent four months to the previous three months. The rolling quarters have no fixed start date and can be used to generate indices as data flows in, significantly reducing multi-month lag time that may be experienced with other indices.
• Includes both fair market and institutional (real estate owned) transactions, giving equal weight to all market transactions and identifying price tiers at a market specific level. By giving equal weight to all transactions, the HDI is truly representative of each unique market.
• Results from an address-level cascade create an index with the most granular, statistically significant market area available.
• Provides weighted repeat sales and price-per-square-foot index models that use multiple sale types, including single-family homes, multi-family homes and condominiums.
The information contained in this report and forecast is based on sources that are deemed to be reliable; however, no representation or warranty is made as to the accuracy, completeness, or fitness for any particular purpose of any information contained herein. This report is not intended as investment advice, and should not be viewed as any guarantee of value, condition, or other attribute.