

The October 2025 Clear Capital Home Data Index (HDI®) Market Report shows national quarter-over-quarter home price growth is at -0.3 percent.
Download the report, or read it below.
Commentary by Brent Nyitray of The Daily Tearsheet
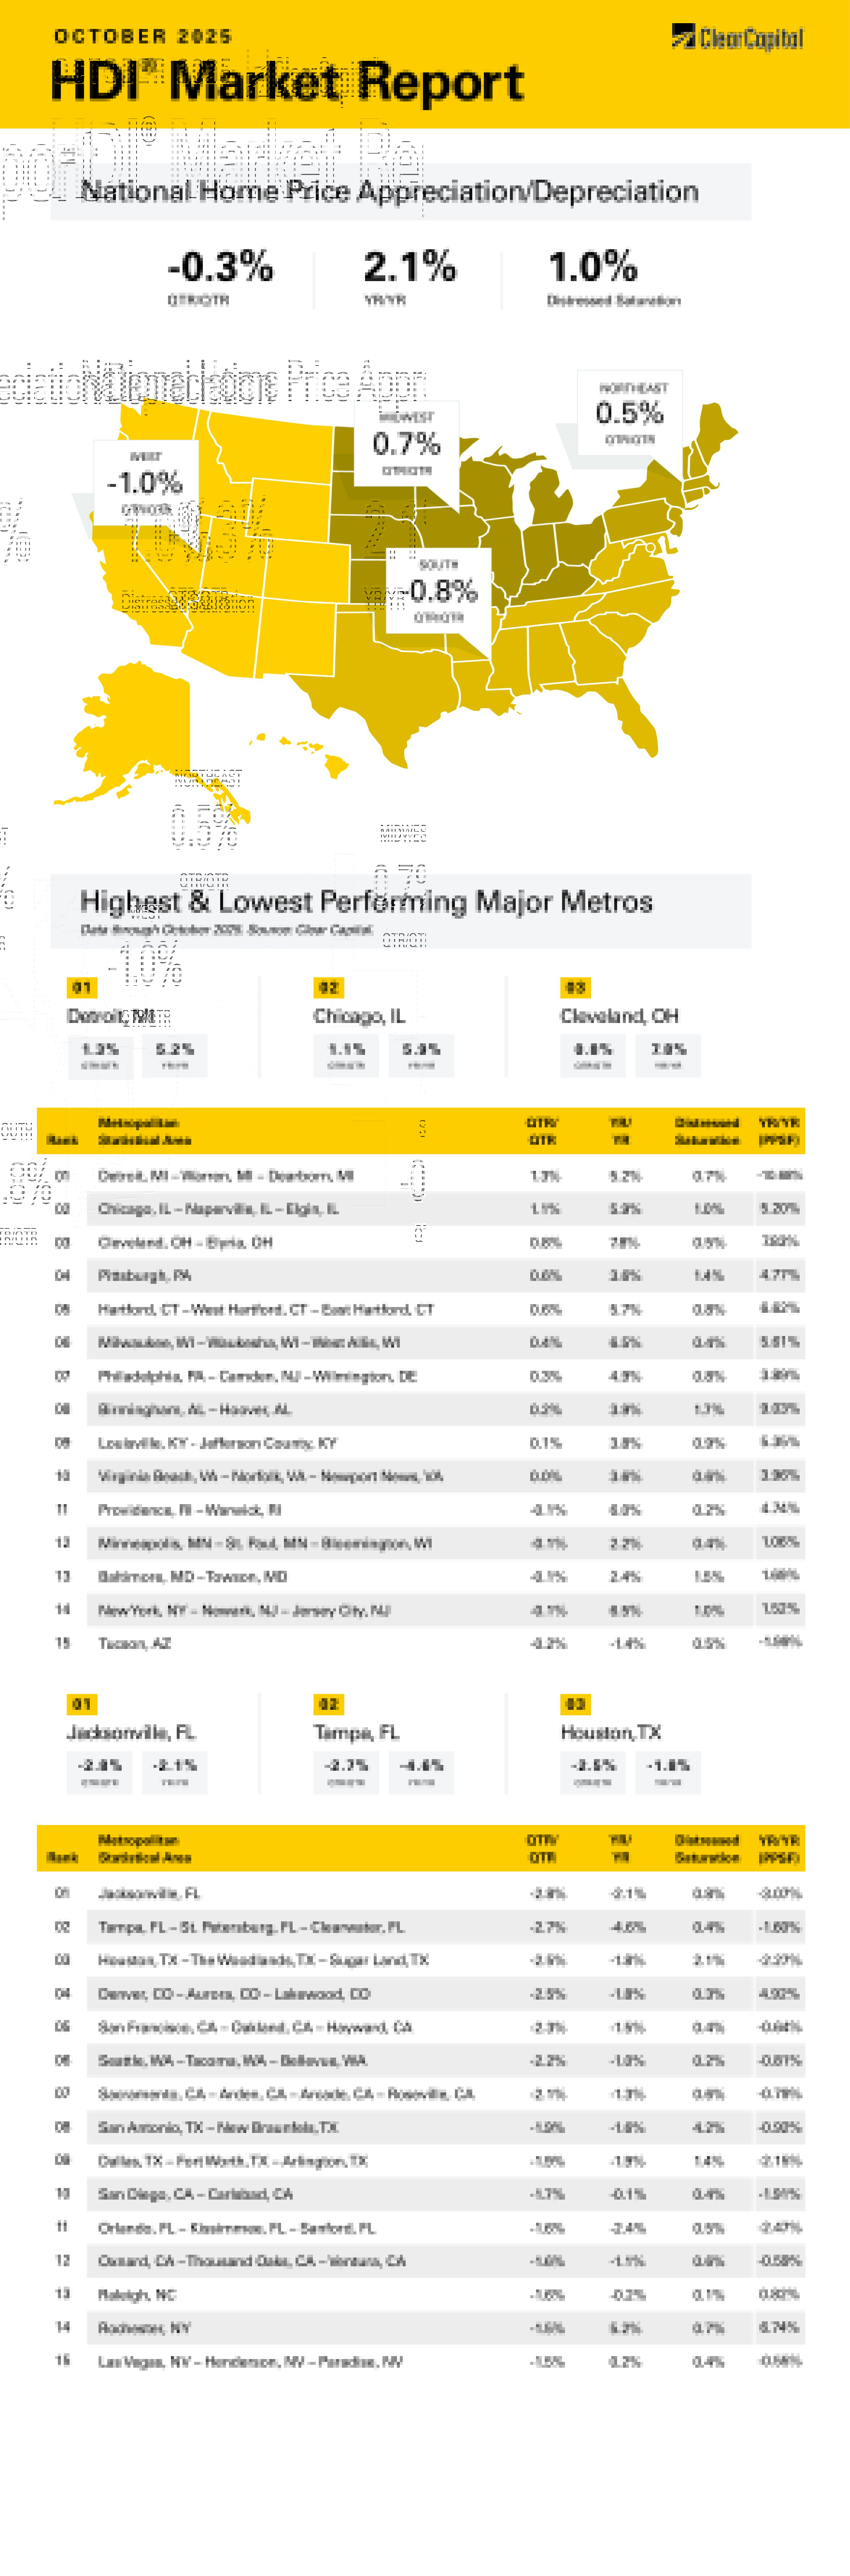
Home price appreciation turned negative on a quarterly basis in October, according to the Clear Capital Home Data Index. National home prices fell 0.3% on a quarterly basis and rose 2.1% annually. The Northeast and the Midwest continue to outperform, while the West and the South struggle.
The Midwest was the top performer on a quarterly basis, rising 0.7% and 4.5% annually. Detroit was the top performer, with prices increasing 1.3% on a quarterly basis and 5.2% on an annual basis. The next best was Chicago, where prices rose 1.1% on a quarterly basis and 5.9% on an annual basis. Cleveland was a top performer as well, with prices rising 0.8% on a quarterly basis and 7.8% on an annual basis.
The Northeast was the next best market, rising 0.5% quarterly and 5.4% annually. The top Northeastern metropolitan statistical area (MSA) was once again Hartford, CT, where prices grew 0.6% on a quarterly basis and 5.7% annually. Philadelphia saw growth, rising 0.3% on a quarterly basis and 4.9% annually. In Providence, RI, prices fell 0.1% on a quarterly basis and rose 6.0% annually. After being one of the leading Northeastern MSAs, Rochester, NY saw a quarterly decline of 1.5%, however annual price growth was still solid at 5.2%.
The South came in third, where prices fell 0.8% on a quarterly basis and rose 0.3% on an annual basis. Birmingham, AL was the top performer, with prices rising 0.2% on a quarterly basis and 3.9% annually. Tampa was beaten up to the tune of 2.7% on a quarterly basis and a whopping 4.6% on an annual basis. In keeping with the Florida markets, Jacksonville also struggled, with prices falling 2.8% quarterly and 2.1% annually. In Houston prices fell 2.5% on a quarterly basis and 1.8% annually.
The West came in last, where prices fell 1.0% on a quarterly basis and rose only 0.1% annually. The only Western MSA to hit the top 15 was Tucson, where prices fell 0.2% quarterly and 1.4% annually. The worst performing MSA was Denver, where prices fell 2.5% on a quarterly basis and 1.8% on an annual basis. San Francisco also struggled, with prices falling 2.3% on a quarterly basis and 1.5% on an annual basis.
As expected, the Fed cut the Fed Funds rate by 25 basis points at the October FOMC meeting. While inflation remains a touch above the Fed’s target of 2%, the feared tariff-driven spike has yet to materialize. Inflation has increased slightly in response to tariffs, not substantially. At the same time, we are seeing warning signs in the labor market — a slew of major layoff announcements, including recent major announcements from Amazon and UPS. Companies are no longer hoarding employees, and employees are now job-hugging when they were quiet quitting a year ago.
The government shutdown has made the Fed’s job more difficult since there has been little to no economic data to guide policy. The Fed is essentially flying blind. Jerome Powell cautioned that a December rate cut was no sure thing given the data blackout. The Fed is reluctant to move too much without economic guideposts. Powell’s comment may well have been directed towards Donald Trump to urge him to re-open the government. Soon after the announcement, Trump advocated eliminating the filibuster, which would allow the Senate to pass a continuing resolution with 51 votes. Senate Republicans have little interest in removing the filibuster, so the shutdown will end when one of the two sides blinks.
Along with the rate decision, the Fed announced that it has reached the end of its quantitative tightening regime. Since raising interest rates in 2022, the Fed has maintained a policy shrinking its balance sheet. During the era of quantitative easing, the Fed purchased trillions of dollars’ worth of treasuries and mortgage-backed securities (MBS). Quantitative tightening meant the Fed would let some of these bonds mature, which would drain the banking system of reserves which is intended to slow the economy and reduce inflation. The Fed is uninterested in returning to its pre-global financial crisis balance sheet of under a trillion in assets.
The Fed announced that it would continue to let its holdings of mortgage-backed securities run off, however it would stop the runoff of treasuries. Any maturing mortgage-backed securities would be replaced with treasuries. What does this mean for mortgage rates? Ultimately, the end of quantitative tightening should mean lower long-term interest rates, which should translate into lower mortgage rates. This should not have much influence on MBS spreads (the difference between mortgage rates and long-term treasuries), which are another determinant of mortgage rates.
What does this mean for real estate prices? Does the Fed’s balance sheet affect home price appreciation? It appears so, at least in one direction. The data indicates that quantitative easing pushed up home prices, however quantitative tightening has a much less dramatic effect.
Below is a chart comparing the year-over-year change in the Fed’s holding of mortgage-backed securities versus home price appreciation. The dashed line is home price appreciation, which moved solidly upward in the aftermath of the Fed’s big investment in mortgage-backed securities. The solid line is the percentage change in the Fed’s holding of MBS.
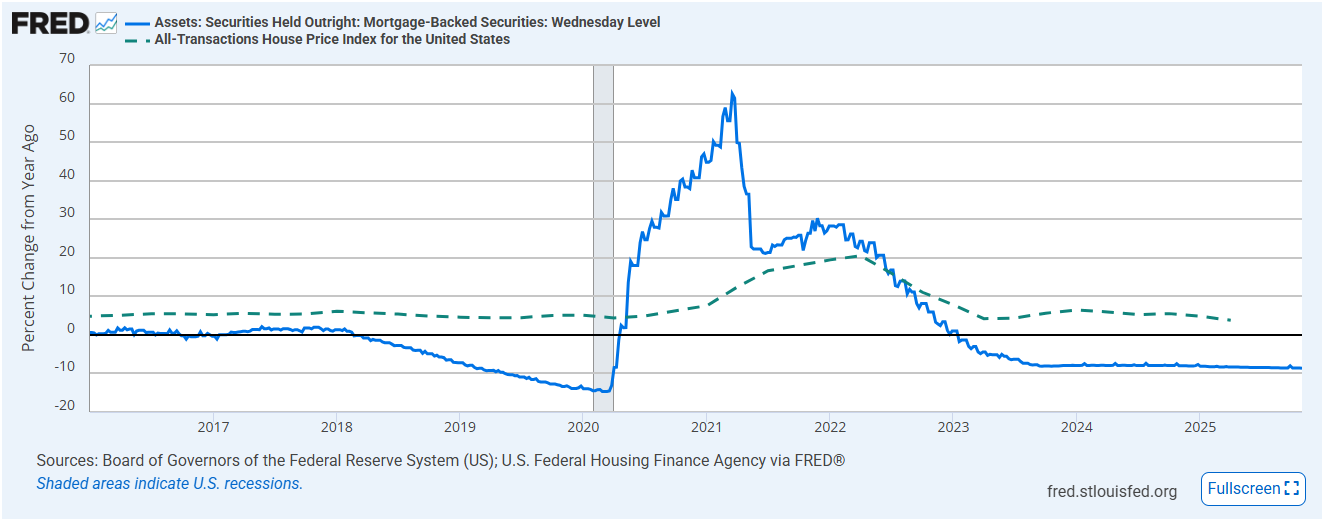
It certainly appears that the two numbers correlate. You can see the effect of quantitative easing during the pandemic translating into higher home price appreciation, and as the Fed reversed policy in 2022, home price appreciation slowed. It also looks like the reduction in MBS holding in 2018 and 2019 dampened home price appreciation.
This implies the change in Fed policy regarding its balance sheet will probably have at most a marginal effect on home price appreciation. Lower mortgage rates will help, but the Fed is merely continuing its current policy for MBS. That said, a lot of real estate prognosticators are predicting the change will be a major positive for mortgage rates and the residential real estate market. This is optimistic. Affordability may improve, however real estate transactions are still held hostage by the rate lock-in effect and more favorable rental rates. 2025 will be better than 2024, but we are a long way from the salad days of 2020 and 2021.
About the Clear Capital Home Data Index (HDI®) Market Report and Forecast
The Clear Capital HDI Market Report and Forecast provides insights into market trends and other leading indices for the real estate market at the national and local levels. A critical difference in the value of Clear Capital’s HDI Market Report and Forecast is the capability to provide more timely and granular reporting than nearly any other home price index provider.
Clear Capital’s HDI Methodology
• Generates the timeliest indices in patent pending, rolling quarter intervals that compare the most recent four months to the previous three months. The rolling quarters have no fixed start date and can be used to generate indices as data flows in, significantly reducing multi-month lag time that may be experienced with other indices.
• Includes both fair market and institutional (real estate owned) transactions, giving equal weight to all market transactions and identifying price tiers at a market specific level. By giving equal weight to all transactions, the HDI is truly representative of each unique market.
• Results from an address-level cascade create an index with the most granular, statistically significant market area available.
• Provides weighted repeat sales and price-per-square-foot index models that use multiple sale types, including single-family homes, multi-family homes and condominiums.
The information contained in this report and forecast is based on sources that are deemed to be reliable; however, no representation or warranty is made as to the accuracy, completeness, or fitness for any particular purpose of any information contained herein. This report is not intended as investment advice, and should not be viewed as any guarantee of value, condition, or other attribute.