

The March 2026 Clear Capital Home Data Index (HDI®) Market Report shows national quarter-over-quarter home price growth is at -0.1 percent.
Download the report, or read it below.
Commentary by Brent Nyitray of The Daily Tearsheet
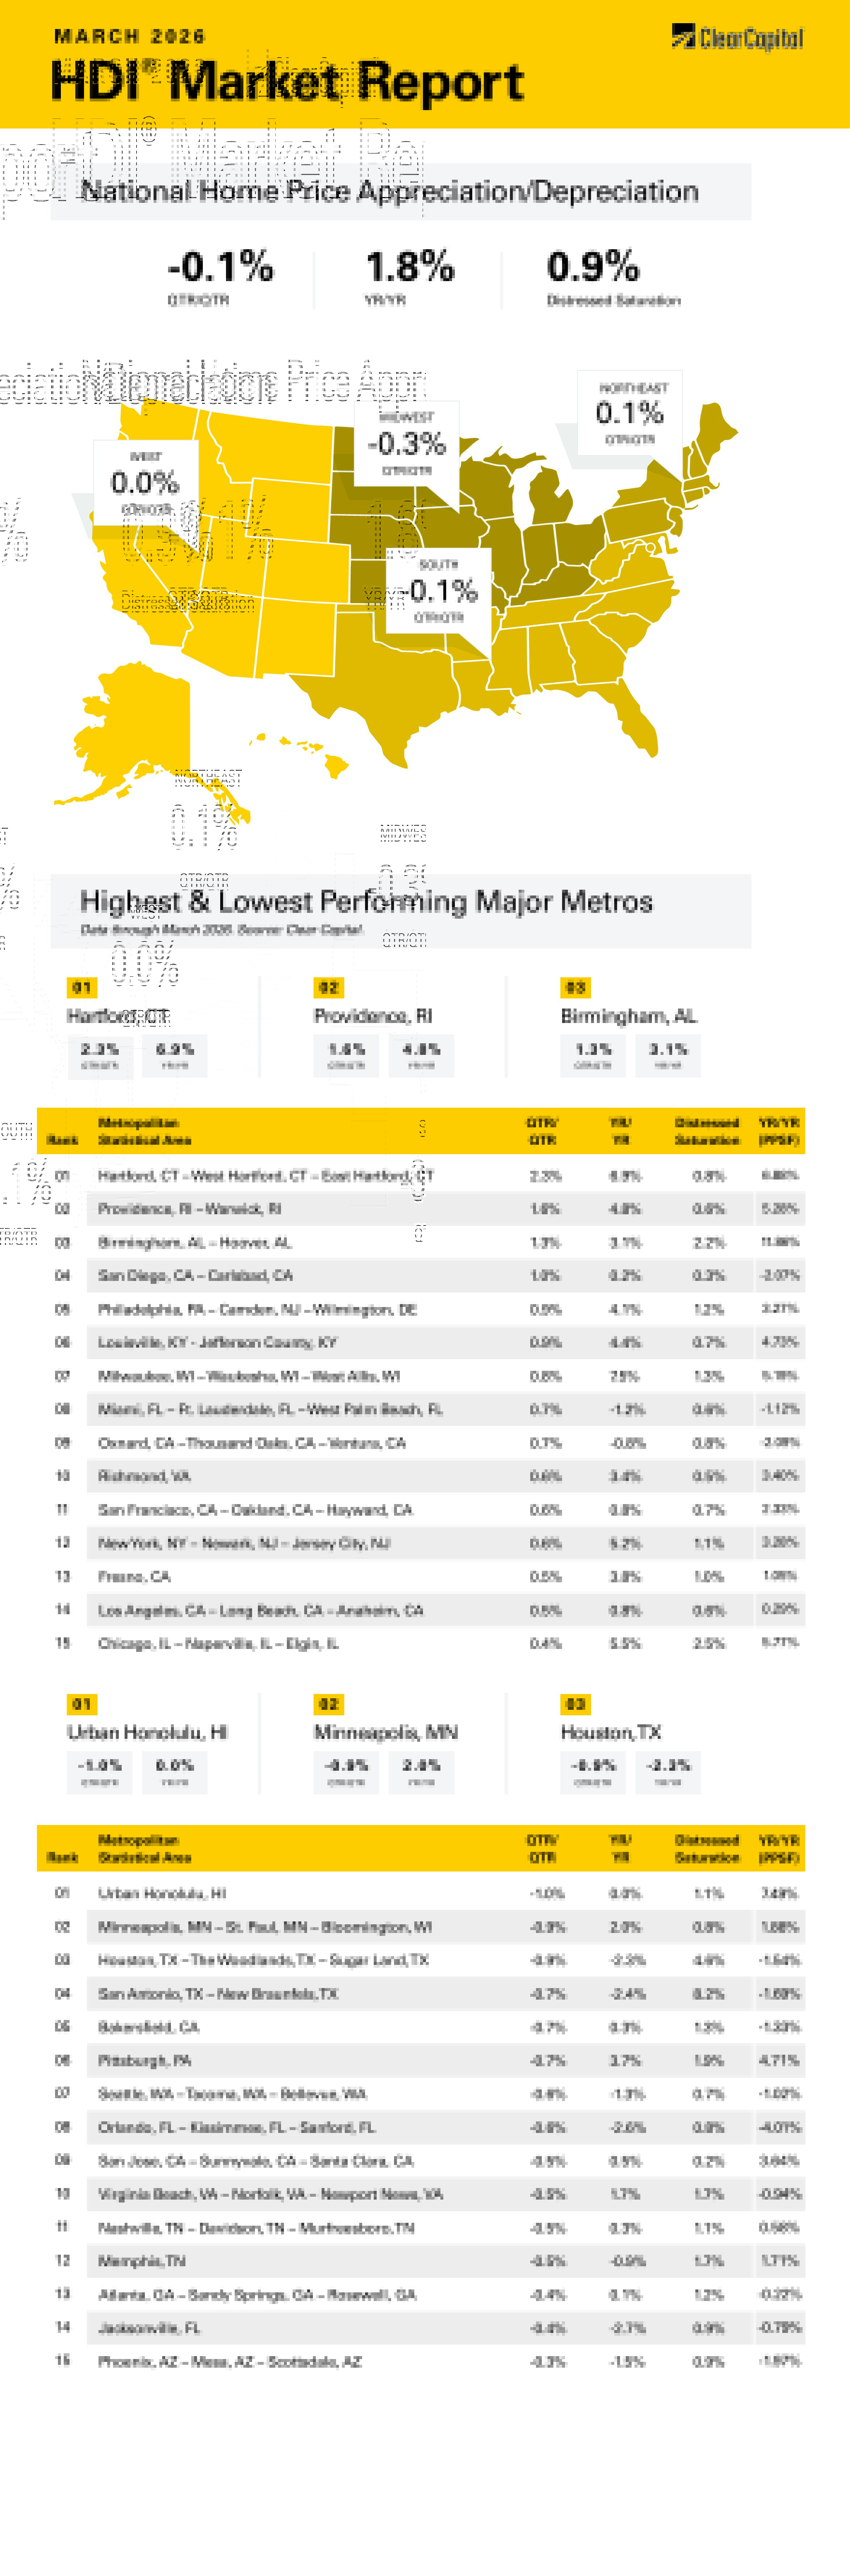
Home price appreciation remained negative in March, according to the Clear Capital Home Data Index. Nationally, home prices fell 0.1% on a quarterly basis and rose 1.8% annually. One region rose on a quarterly basis, while one was flat and two were negative. All of the top 15 MSAs exhibited positive quarterly growth.
The Northeast was the top market, rising 0.1% quarterly and 4.9% annually. The top Northeastern metropolitan statistical area (MSA) was Hartford, CT, where prices grew 2.3% on a quarterly basis and 6.9% annually. Providence, RI was also a leader, rising 1.6% on a quarterly basis and 4.8% annually. In New York City, prices rose 0.6% on a quarterly basis and 5.2% annually. Philly was also strong, with prices rising 0.9% quarterly and 4.1% annually.
The Midwest was the next best performer, with prices falling 0.3% but still rising 4.0% annually. Milwaukee, WI showed impressive growth, rising 0.8% quarterly and 7.5% annually. In Chicago, prices rose 0.4% quarterly and 5.5% annually. The weakest Midwestern MSA was Minneapolis, where prices fell 0.9% on a quarterly basis but rose 2.0% annually.
The South came in third, where prices fell 0.1% on a quarterly basis and rose 0.2% on an annual basis. Louisville, KY was the top performer, with prices rising 0.9% on a quarterly basis and rising 4.4% on an annual basis. Birmingham, AL saw prices rise 1.3% on a quarterly basis and up 3.1% annually. Richmond, VA was in the top 15, where prices rose 0.6% on a QOQ basis and 3.4% annually. Miami continued its rebound with prices rising 0.7% quarterly. Houston was one of the worst-performing MSAs, with prices falling 0.9% quarterly and 2.3% annually. Nashville was also a laggard.
The West came in last, where prices were flat on a quarterly basis and fell 0.1% annually. The top Western MSA was Fresno, CA, where prices rose 0.5% quarterly and 3.8% annually. San Francisco was also in the top 15, with prices increasing 0.6% quarterly and 0.8% annually. The worst-performing MSA was Bakersfield, CA, where prices fell 0.7% on a quarterly basis and rose 0.3% on an annual basis. Seattle also struggled, with prices falling 0.6% on a quarterly basis and 1.3% on an annual basis. Phoenix saw prices fall 0.3% quarterly and 1.5% on a year-over-year basis.
The situation in Iran has ripped up the script on the forecast for 2026. The operation came out of the blue, which dramatically increased uncertainty and volatility in the markets. Typically, you would expect to see longer-term rates fall in response to international hostilities as investors flee to safer assets. Not this time. Inflation fears are taking center stage.
About 20-25% of global petroleum trade goes through the Strait of Hormuz, and traffic has been at a virtual standstill since the war began. Oil in the U.S. has shot up from $67 per barrel to $110. As Iran has attacked its neighbors in the Gulf, energy infrastructure is being taken out of commission. An attack on Qatar’s liquefied natural gas facilities took out about 17% of their capacity. This infrastructure needs to be rebuilt, so even if the war ended tomorrow, it would take time (years) for this supply to return. While China and Japan will have to worry about shortages, that shouldn’t be a problem for the U.S., which gets only about 2% of its supply from the Gulf.
The disruption in the Gulf is spilling over to other goods, which will push inflation upward. For example, roughly 50% of the world’s supply of urea (an input for fertilizer) goes through the Strait of Hormuz. Around 30% of ammonia goes through the Strait. Rising fertilizer prices will be felt in higher food prices. Polyethylene prices (an input into plastics) are seeing big increases. The inflationary impact of the war in Iran is more than just prices at the pump or airline fares.
Before the war began, the markets were predicting a benign 2026 for the bond market and hopefully the real estate market. The Supreme Court overturned most of Trump’s tariffs, and his extension will expire. The tariff effect on the inflation indices is estimated to be around 0.4% or so, which means that absent the tariffs, inflation would be within shouting distance of the Fed’s target. Once the tariffs officially expire, the thinking was that the Fed would be free to let the Fed Funds rate fall to neutrality.
Not anymore. The December Fed Funds futures see no more movement in rates as the base case (a month ago, they saw 50 basis points in cuts) and they are pricing in some chance of rate hikes. Jerome Powell said that he is currently “looking through” the jump in oil prices, but there is a limit. In other words, rate hikes are off the table, for now.
Mortgage rates have increased less than the 10-year has. Mortgage spreads (the difference between mortgage rates and treasuries) are on the low side, which represents potential risk for mortgage rates if spreads return to normal. In other words, if a 10-year yield around 4.4% is the new normal, mortgage rates have limited room to move lower.
This is affecting the real estate market in general. Redfin reported that 14% of sale agreements fell through in February, which was a record. Buyers have the upper hand in many MSAs and are walking away after an inspection shows a problem, confident that they can find another property. Note these are February numbers, and the war in Iran started at the end of the month. We can only assume the war didn’t improve the situation.
Last year’s spring selling season was dented by tariffs and the resulting rise in inflation. Real estate professionals had hoped that 2026 would be a return to normalcy. The war in Iran poured cold water on that forecast. The Home Data Index shows that real estate price appreciation is barely positive, which is being confirmed in the other home price indices. Given the jump in mortgage rates and uncertainty overall in the market, this trend will probably continue.
About the Clear Capital Home Data Index (HDI®) Market Report and Forecast
The Clear Capital HDI Market Report and Forecast provides insights into market trends and other leading indices for the real estate market at the national and local levels. A critical difference in the value of Clear Capital’s HDI Market Report and Forecast is the capability to provide more timely and granular reporting than nearly any other home price index provider.
Clear Capital’s HDI Methodology
• Generates the timeliest indices in patent pending, rolling quarter intervals that compare the most recent four months to the previous three months. The rolling quarters have no fixed start date and can be used to generate indices as data flows in, significantly reducing multi-month lag time that may be experienced with other indices.
• Includes both fair market and institutional (real estate owned) transactions, giving equal weight to all market transactions and identifying price tiers at a market specific level. By giving equal weight to all transactions, the HDI is truly representative of each unique market.
• Results from an address-level cascade create an index with the most granular, statistically significant market area available.
• Provides weighted repeat sales and price-per-square-foot index models that use multiple sale types, including single-family homes, multi-family homes and condominiums.
The information contained in this report and forecast is based on sources that are deemed to be reliable; however, no representation or warranty is made as to the accuracy, completeness, or fitness for any particular purpose of any information contained herein. This report is not intended as investment advice, and should not be viewed as any guarantee of value, condition, or other attribute.