

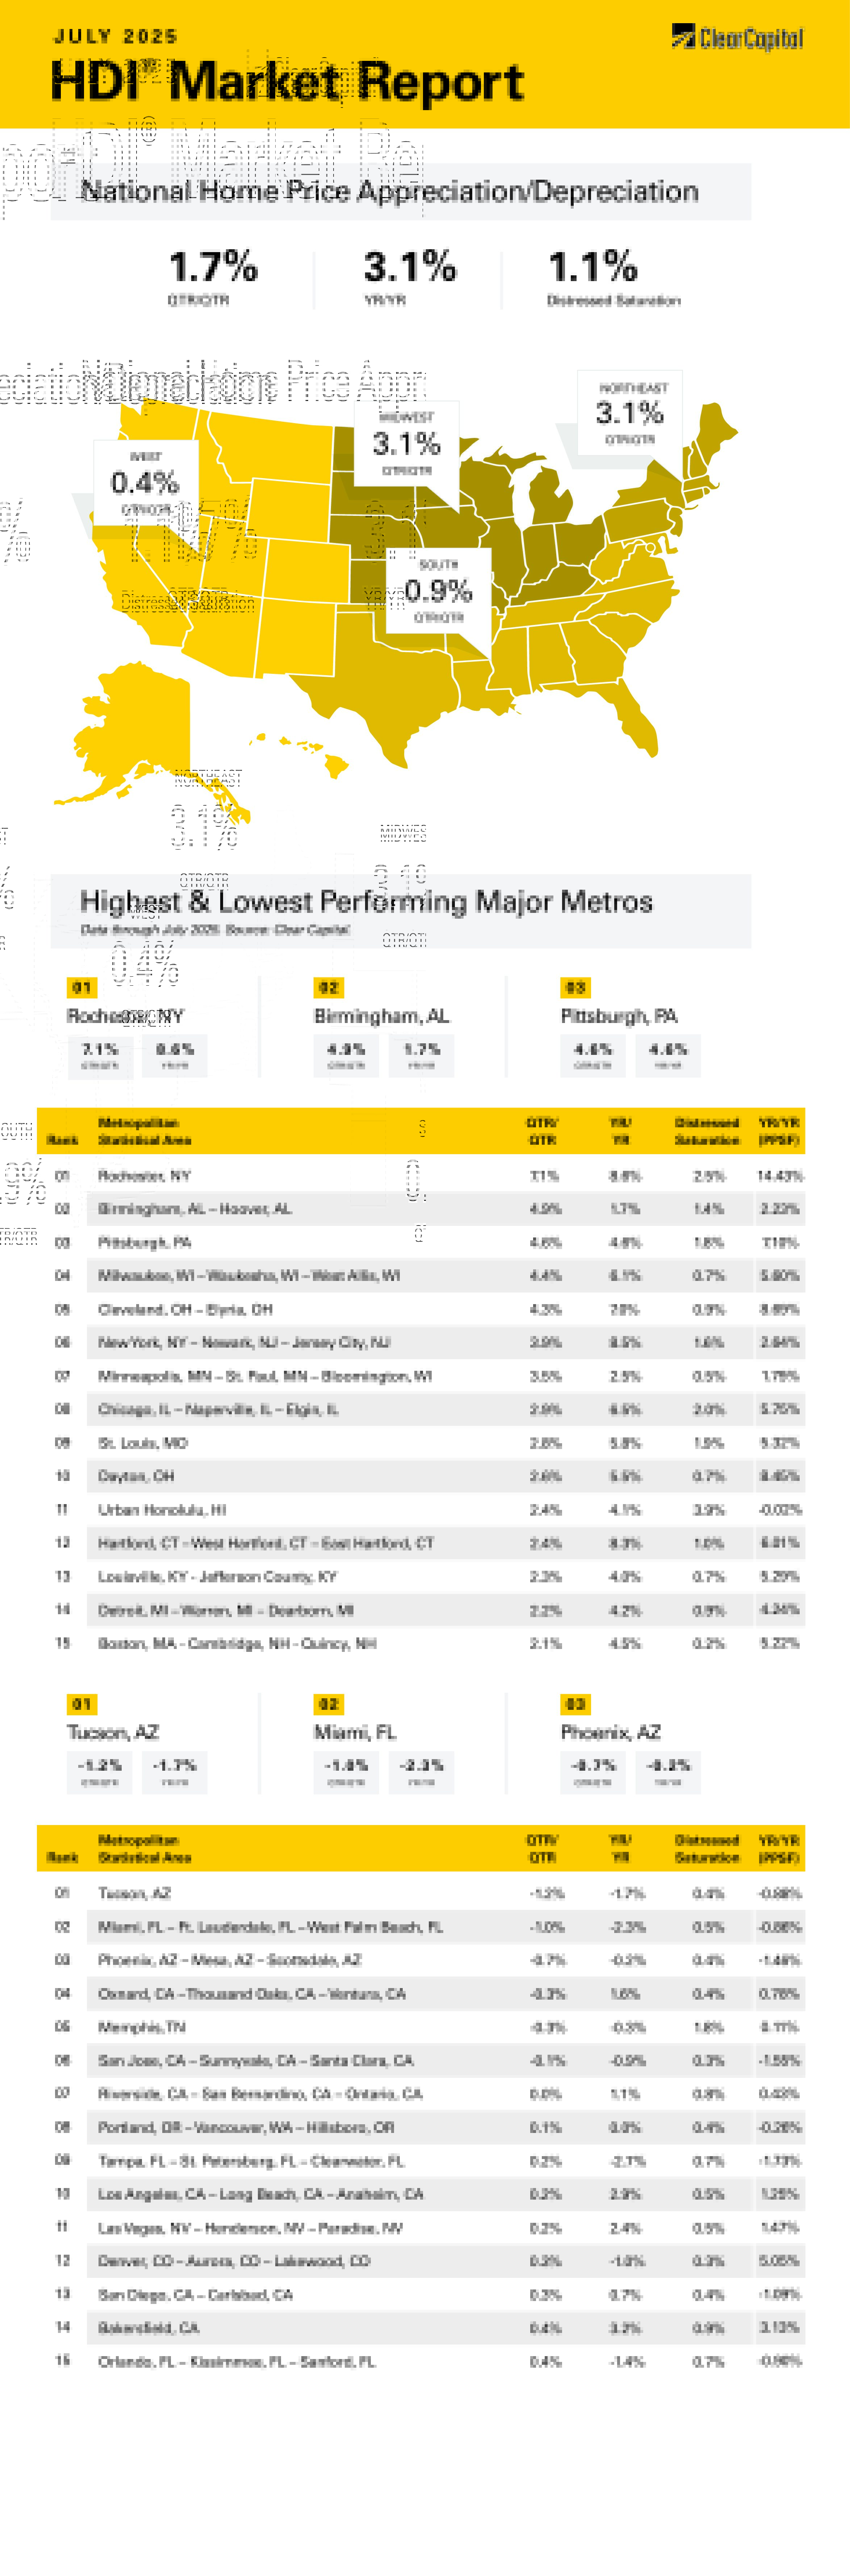
The July 2025 Clear Capital Home Data Index (HDI®) Market Report shows national quarter-over-quarter home price growth is at 1.7 percent.
Download the report, or read it below.
Commentary by Brent Nyitray of The Daily Tearsheet
Home price appreciation continued to slow in July, according to the Clear Capital Home Data Index. National home prices rose 1.7% on a quarterly basis and 3.1% annually. The Northeast and the Midwest continue to outperform, while the previously hot markets in Florida and the Sunbelt struggle.
The Northeast was the top performing market on a quarterly basis, rising 3.1%. Prices rose 6.7% on an annual basis. The top Northeastern Metropolitan Statistical Area (MSA) was Rochester, NY, where prices rose 7.1% on a quarterly basis and 8.6% annually. The New York City area saw strong growth, rising 3.9% on a quarterly basis and 8.5% annually. Hartford, CT also performed well, rising 2.4% quarterly and 8.3% on an annual basis.
The Midwest was the next best performer, with prices rising 3.1% on a quarterly basis and 4.9% annually. Milwaukee, WI was the top performer, with prices rising 4.4% on a quarterly basis and 6.1% on an annual basis. Cleveland, OH saw prices rise 4.3% on a quarterly basis and 7.0% on an annual basis. Minneapolis was a top performer as well, with prices rising 3.5% on a quarterly basis and 2.5% on an annual basis.
The South came in third, where prices rose 0.9% on a quarterly basis and 1.1% on an annual basis. Birmingham, AL was the top performer, with prices rising 4.9% on a quarterly basis and 1.7% annually. Miami was one of the worst performing MSAs in the South, with prices falling 1% quarterly and 2.3% annually. Memphis also struggled, with prices falling 0.3%.
The West came in last, where prices rose 0.4% on a quarterly basis and 1.1% annually. The only Western MSA to hit the top 15 was Honolulu, where prices rose 2.4% quarterly and 4.1% annually. The worst performing MSA was Tucson, AZ, where prices fell 1.2% on a quarterly basis and 1.7% on an annual basis. Phoenix also struggled, with prices falling 0.7% on a quarterly basis and 0.2% on an annual basis.
As expected, the Fed made no changes to monetary policy despite a lack of any meaningful tariff-driven inflation. In the post decision press conference, Jerome Powell stated that “The economy is not performing as though restrictive policy were holding it back inappropriately.” This admission caused the markets to discount further rate cuts this year, and the September Fed Funds futures went from predicting a cut to no changes.
That statement is somewhat ominous in that it shows the Fed might be re-assessing r-star or the neutral rate of monetary policy. The current consensus is that the neutral rate is somewhere between 3% and 3.5%. If the economy is handling a Fed Funds rate of 4.25% – 4.5% without weakening, perhaps r-star is higher, and the Fed doesn’t need to cut rates as much. The Fed seems to be saying that unless we see a material weakening in employment, they are content to leave rates here.
Evidence of a weakening labor market arrived with the jobs report, where the headline number of jobs created was relatively anemic, but the May and June payroll numbers were revised downward to almost nothing. Trump fired the head of the BLS, alleging the agency was “rigging” the data. That said, the revisions have been a big problem, and last’s payroll numbers were overestimated by 810,000. The inaccurate estimates do create a problem for economists and the Fed. Would the Fed have eased in July, knowing that payroll growth has stalled for the past 3 months? Maybe not, but would the statement about restrictive policy still be valid? No.
After the big payroll revision, markets started to re-price in a rate cut at the September meeting. Even with the downward revision in payrolls, the BLS models still overstate the strength of the labor market. The unemployment numbers are being held down by people exiting the labor force, not by people getting jobs. The labor force participation rate continues to fall, and the number of people collecting paychecks decreased again. The labor market is a lot softer than the unemployment rate suggests.
Where does this leave the real estate market? The 2025 Spring Selling season was largely a dud, as existing home sales remain anemic. The market seems to be moving closer to balance, although affordability constraints continue to dominate the landscape. The policy prescriptions out of Washington are more window-dressing than anything (opening more Federal Lands for housing, eliminating capital gains taxes) and are unlikely to address the ultimate problem of limited supply.
New home sales continue to disappoint, with builders sitting on inventory. They have used mortgage buydowns to help improve affordability with limited success. Regulatory red tape continues to be an issue for expensive MSAs in Southern California.
Perhaps the partial answer to the housing problem is embedded in the data above. The MSAs that are experiencing the highest growth lagged the rest of the US on the big post-2008 real estate rally. Places like Rochester, NY and Cleveland, OH have been cheap for so long, they are becoming impossible to ignore. Florida is no longer cheap and has its own set of issues with condo capital expenditures and insurance costs.
The Rust Belt seems to be having a renaissance with lots of home price appreciation in Ohio. Health care spending is a growth industry there. Detroit, Michigan, the home of Rocket Mortgage and United Wholesale might be more aptly named the Mortgage City. The answer to the affordability crisis might simply be to move somewhere cheaper.
About the Clear Capital Home Data Index (HDI®) Market Report and Forecast
The Clear Capital HDI Market Report and Forecast provides insights into market trends and other leading indices for the real estate market at the national and local levels. A critical difference in the value of Clear Capital’s HDI Market Report and Forecast is the capability to provide more timely and granular reporting than nearly any other home price index provider.
Clear Capital’s HDI Methodology
• Generates the timeliest indices in patent pending, rolling quarter intervals that compare the most recent four months to the previous three months. The rolling quarters have no fixed start date and can be used to generate indices as data flows in, significantly reducing multi-month lag time that may be experienced with other indices.
• Includes both fair market and institutional (real estate owned) transactions, giving equal weight to all market transactions and identifying price tiers at a market specific level. By giving equal weight to all transactions, the HDI is truly representative of each unique market.
• Results from an address-level cascade create an index with the most granular, statistically significant market area available.
• Provides weighted repeat sales and price-per-square-foot index models that use multiple sale types, including single-family homes, multi-family homes and condominiums.
The information contained in this report and forecast is based on sources that are deemed to be reliable; however, no representation or warranty is made as to the accuracy, completeness, or fitness for any particular purpose of any information contained herein. This report is not intended as investment advice, and should not be viewed as any guarantee of value, condition, or other attribute.