

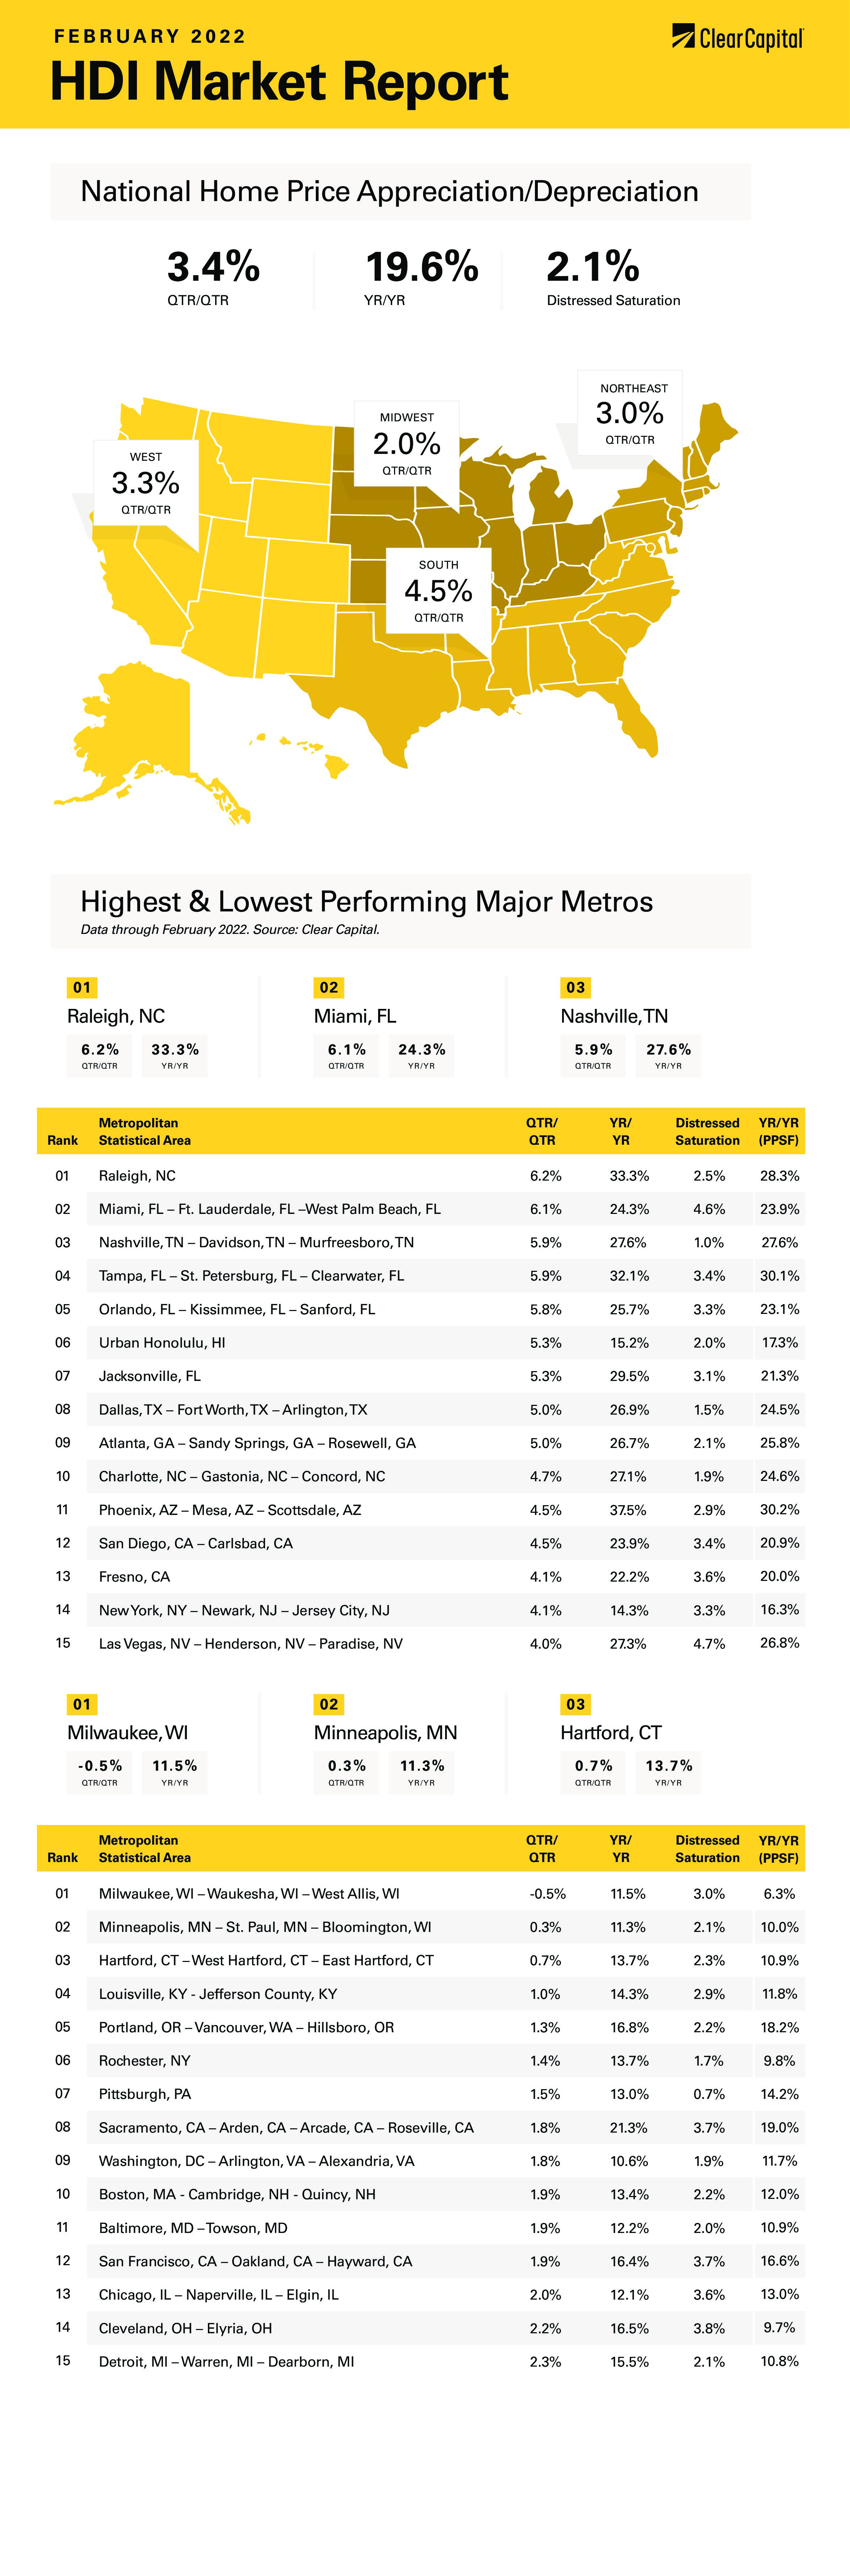
The February 2022 Home Data Index™ (HDI™) Market Report shows national quarter-over-quarter (QoQ) home price growth is at 3.4 percent.
Download the report, or read it below.
* Note that due to unprecedented conditions in spring 2020 (due to COVID restrictions) and tight inventory in spring 2021, the year-over-year numbers based upon paired sales in certain rapidly-rising markets (like Phoenix) may be overstated. In that case, we encourage the consideration of the additional year-over-year comparison based upon price-per-square-foot, which may be more in line with market dynamics in this situation.
Commentary by Brent Nyitray of The Daily Tearsheet
Home price appreciation continued last month as the Clear Capital Home Data Index rose 3.4% quarter-over-quarter (QoQ) and 19.6% on a year-over-year (YoY) basis. This was a slight uptick from the January pace of 3.4% QoQ and 19.5% YoY. Every region reported home price appreciation, and some of the hottest markets like Phoenix are seeing quarterly price appreciation revert to the mean. Florida remains one of the strongest states overall, taking three of the top five metropolitan statistical areas (MSAs).
The fastest growing region remains the West, which grew 23% last month. Again, Phoenix was again the leader, with prices rising 38%. Other notable western MSAs include Las Vegas, where prices rose 27% and San Diego, where they rose 24%.
The South came in second at 23%, with a slew of metropolitan statistical areas in the top ten. North Carolina did will, with Raleigh real estate rising 33% and Charlotte rising 27%. Florida had a slew of leaders, including Miami (up 24%), Tampa (up 32%), Orlando (up 26%) and Jacksonville (up 30%).
The Northeast came in next, where prices rose 16% on a YoY basis. One of the biggest laggards has been the New York City area, which has been battered by job losses in finance. Things may be turning around there, as prices rose 14% YoY, and accelerated on a quarterly basis, rising 4.1%.
Finally, the Midwest saw a 15% increase in prices. Since the top 15 MSAs were dominated by the South and West, no Midwestern MSAs made the list. The slowest MSA went to Milwaukee, where prices fell on a quarterly basis, but were still up 12% year-over-year. Minneapolis was also a laggard, with prices increasing only 0.3% on a quarter-over quarter basis and rising 11% annually.
Over the past few weeks, the opinion of the Federal Reserve and the market have diverged when it comes to interest rate forecasts for this year. The Fed puts out a forecast of the Fed Funds rate every quarter (called the dot plot) and it shows the different individual members’ forecast for interest rates. At the December meeting, the forecast looked like this:
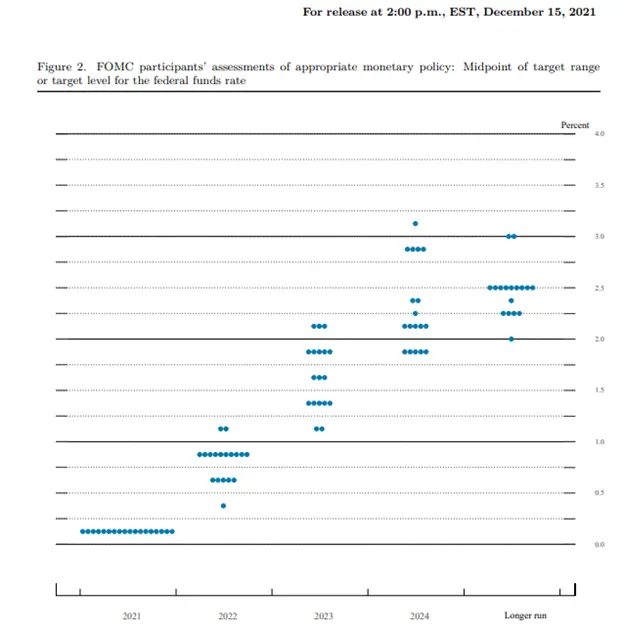
Each dot represents the forecast of an individual member, say Jerome Powell or Lael Brainard. The x-axis represents the time, and the y-axis represents the expected Fed Funds rate. If you look at 2022, most of the dots are in the fourth row, which means most members saw the Fed Funds rate rising to a range of 0.75% to 1% by the end of 2022. This was the Fed’s forecast as of mid-December 2021.
The market also has a forecast via the Fed Funds futures. These are derivative contracts which trade on the Chicago Mercantile Exchange and the exchange can back out the market’s implied probabilities for where rates will be after a particular FOMC meeting. Here is the market’s forecast of rates after the December 2022 FOMC meeting:

The market is predicting that the Fed Funds rate will probably be between 1.5% and 2% by the end of the year. The Fed thinks they will be 0.75%. In fact, the market is assigning only a 0.4% chance of the Fed’s own forecast being right. This is a massive divergence, and it represents the changes we have seen in inflation over the past two months. In market parlance, this indicates the market thinks the Fed is behind the curve.
The recent invasion of Ukraine presents a major problem for the Fed. Oil prices have been taking off, and rising gasoline prices depress consumer spending, which is roughly 70% of the US economy. The government’s estimate for fourth quarter 2021 GDP growth was 7%, which is quite healthy. That strength doesn’t appear to be continuing into 2022. The Atlanta Fed’s GDP Now estimate (a real-time estimate of growth) currently sees Q1 GDP coming in at 1.3%, which is a serious deceleration. The latest University of Michigan Consumer Sentiment Survey hit a decade low as wage growth is not keeping up with inflation.
The combination of rising commodity prices and slowing growth has some market forecasters starting to mention stagflation. If the market is correct, and the Fed is going to be raising short-term interest rates by 1.5 – 2% this year, it won’t take much to push an economy growing at only 1.3% into flat-to-negative growth. If this invasion turns into something that affects markets all year, then the Fed will be forced to choose between sluggish growth and inflation. This was exactly the choice the Fed was left with during the 1970s. This becomes an even bigger headache if world leaders decide to cut Russia off from the SWIFT banking network. Russian debt would collapse and that could create a contagion in the financial markets, especially if some big hedge funds hold a decent amount. Old timers probably remember that the Russian debt default of 1998 took out Long Term Capital Management, and that had reverberations all throughout the financial markets.
The Fed is probably hoping that dampening consumer sentiment will take some starch out of the economy. Instead of raising rates to slow the economy, the hope would be that it would slow naturally, and as supply chain issues work themselves out, that inflation will get back in line with the Fed’s 2% goal. Suffice it to say the facts on the ground have changed dramatically since the December FOMC meeting and we could see some volatility in the markets going forward as events unfold.
About the Clear Capital Home Data Index™ (HDI™) Market Report and Forecast
The Clear Capital HDI Market Report and Forecast provides insights into market trends and other leading indices for the real estate market at the national and local levels. A critical difference in the value of Clear Capital’s HDI Market Report and Forecast is the capability to provide more timely and granular reporting than nearly any other home price index provider.
Clear Capital’s HDI Methodology
• Generates the timeliest indices in patent pending, rolling quarter intervals that compare the most recent four months to the previous three months. The rolling quarters have no fixed start date and can be used to generate indices as data flows in, significantly reducing multi-month lag time that may be experienced with other indices.
• Includes both fair market and institutional (real estate owned) transactions, giving equal weight to all market transactions and identifying price tiers at a market specific level. By giving equal weight to all transactions, the HDI is truly representative of each unique market.
• Results from an address-level cascade create an index with the most granular, statistically significant market area available.
• Provides weighted repeat sales and price-per-square-foot index models that use multiple sale types, including single-family homes, multi-family homes and condominiums.
The information contained in this report and forecast is based on sources that are deemed to be reliable; however, no representation or warranty is made as to the accuracy, completeness, or fitness for any particular purpose of any information contained herein. This report is not intended as investment advice, and should not be viewed as any guarantee of value, condition, or other attribute.