

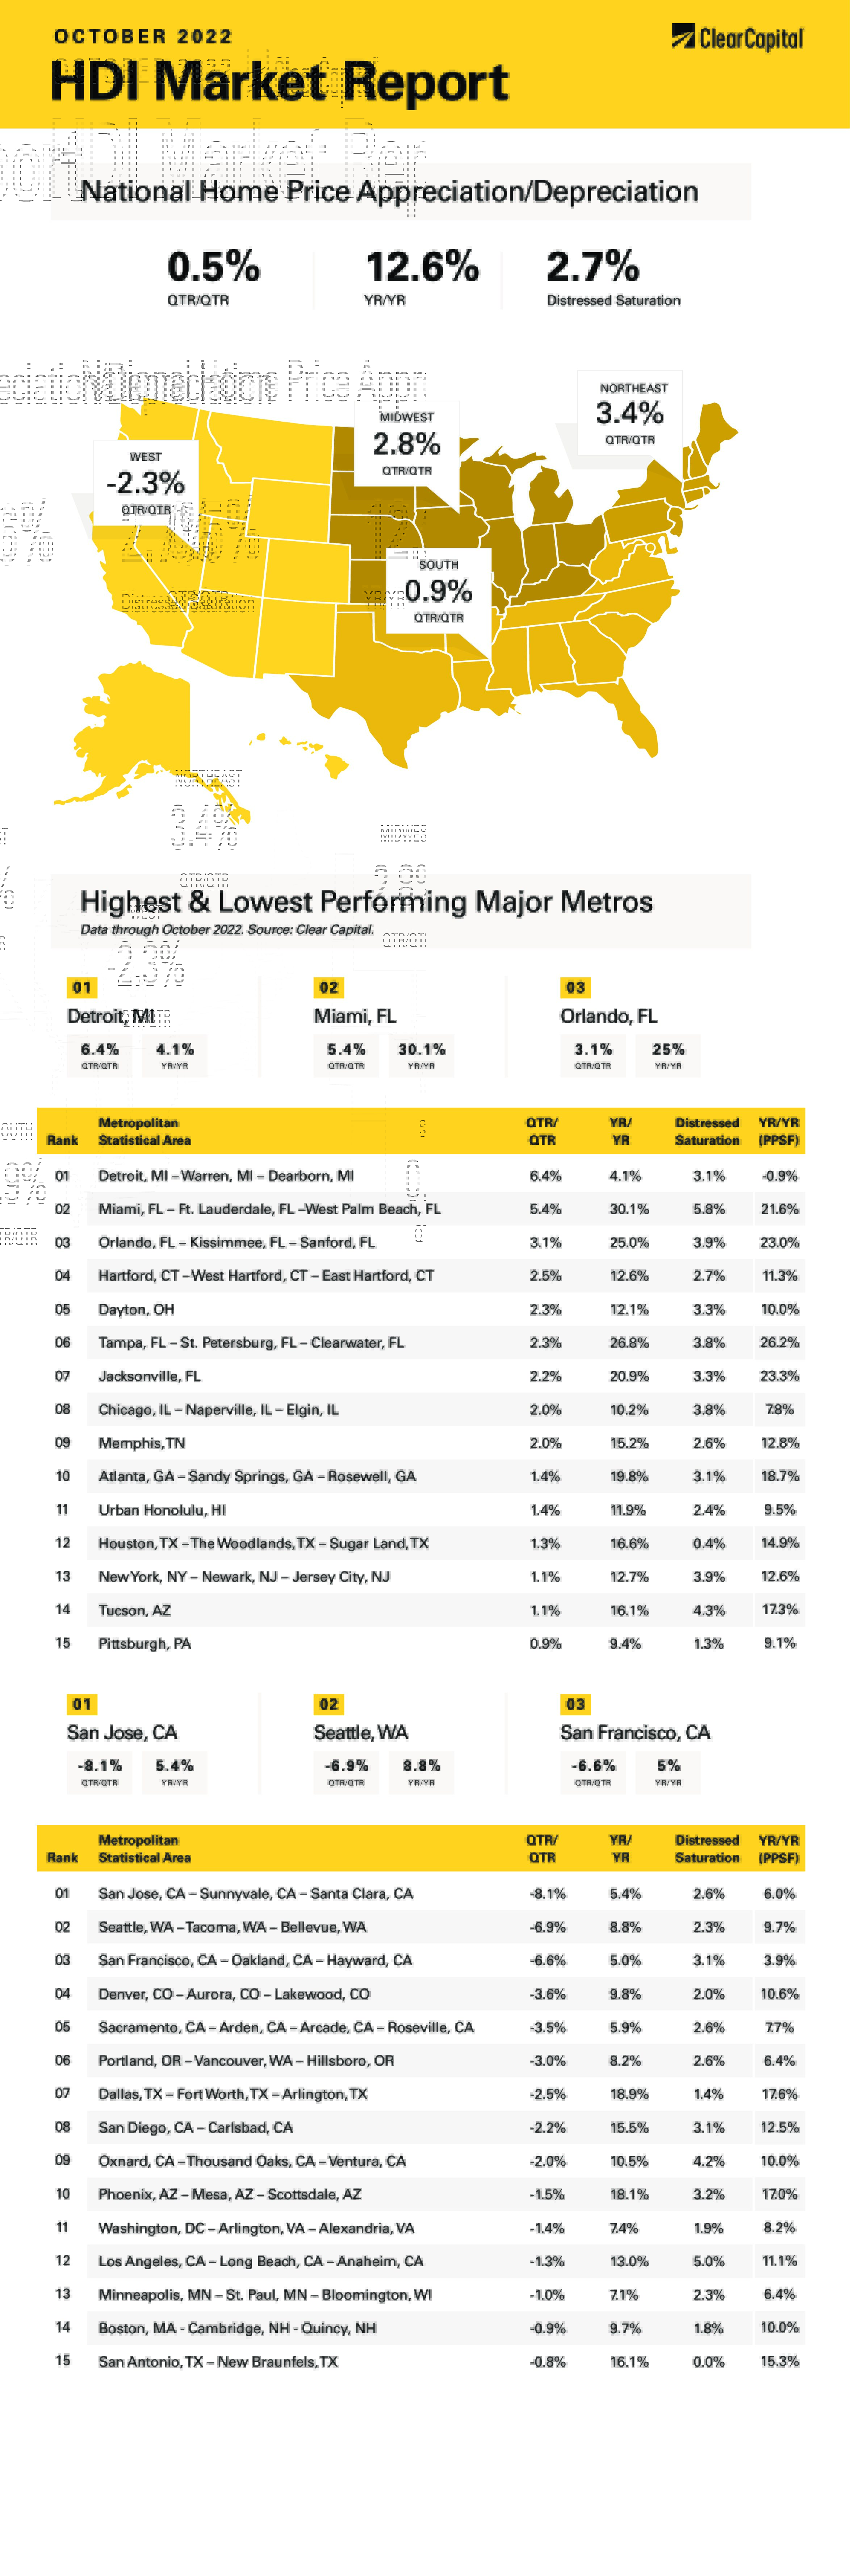
The October 2022 Home Data Index™ (HDI™) Market Report shows national quarter-over-quarter (QoQ) home price growth is at 0.5 percent.
Download the report, or read it below.
Commentary by Brent Nyitray of The Daily Tearsheet
Home price appreciation decelerated again in October as the Clear Capital Home Data Index rose 0.5% quarter-over-quarter (QoQ) and 12.6% on a year-over-year (YoY) basis. This compares to a 4.2% QoQ increase and a 14.8% YoY increase in September. Every region reported except for the West reported home price appreciation, and the hottest region remains Florida.
Interestingly, the Northeast again had the fastest quarterly growth at 3.4% and annual growth came in at 14.3%, with Hartford, Connecticut (up 12.6%) and New York City area (up 12.7%) leading the way. This might be a catch-up situation as the Northeast has been a national laggard since the real estate bubble burst in 2006.
The Midwest came in second, which grew 2.8% QoQ and 8.7% YoY. The leading MSA was Detroit, which rose 6.4% QoQ and 4.1% YoY. Dayton, Ohio rose 12.1% YoY and Chicago was up 10.2%. The Midwest has been a laggard since the real estate bubble burst in 2008.
The South came in next, where prices rose 0.9% QoQ, however it did post the biggest YoY gain at 15.9%. Florida remains exceptionally strong, with Miami up 30.1%, Orlando, Florida up 25%, Tampa, Florida up 26.8%, and Jacksonville, Florida up 21%. It will be interesting to see if the recent hurricane ends up slowing home price appreciation in the state.
Finally, the West saw a 2.3% QoQ decline in prices. Prices still rose 10.8% on a YoY basis. Some of the hottest markets are finally taking a breather. San Jose, California experienced the biggest quarterly decline, falling 8.1%. Seattle was down 6.9%, while San Francisco fell 6.6%. Between rising home prices and mortgage rates, much of California has become extremely unaffordable.
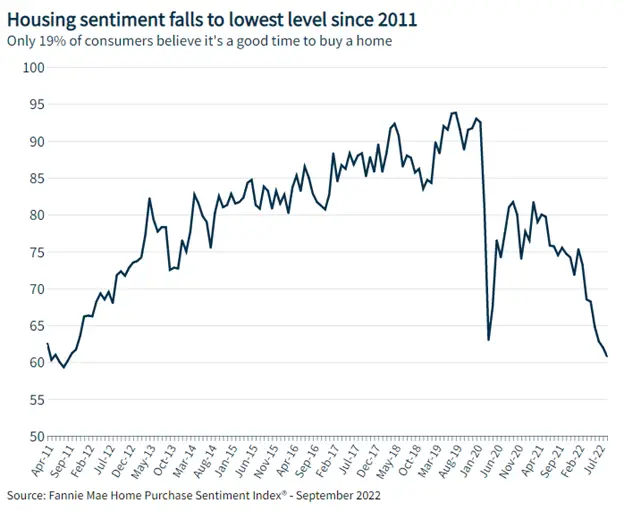
Housing sentiment has taken a turn for the worse. According to the Fannie Mae Home Purchase Sentiment Index, buyer sentiment fell to the lowest level since 2011, when the US housing market was bottoming. The survey reported that 75% of consumers think it is a bad time to buy a home. This was driven by high prices, a jump in mortgage rates, and negative sentiment about the economy overall. This is something the Fed has been eager to see, as it is afraid that rising home equity is increasing unsustainable consumption.
The fears of a recession were supported by a hawkish forecast from the Fed during the September FOMC meeting. The dot plot showed a full point increase in the forecast for the end of year Fed Funds rate from a target range of 3.25% – 3.5% to a range of 4.25% – 4.5%. The Fed also took down its forecast for economic growth in 2022 and 2023. Overall, the September Fed meeting poured cold water on the idea that the Fed might be close to “pivoting” to a more neutral stance. Several Fed Presidents also stressed the point that the data on inflation hasn’t changed much. The September Consumer Price Index showed that the core rate of inflation has indeed been stubbornly high.
Mortgage rates have been rising at a steady clip, but I suspect the highs of this cycle have already been seen and mortgage rates should work their way lower as the Fed wraps up its tightening cycle. This is largely because of technical aspects in how bond fund managers handle redemptions. Bond funds have seen outflows accelerate into the end of September. Historically, when money is exiting the fixed income market, mortgage-backed securities feel the effects first. Mortgage REITs have been hammered due to this phenomenon of “widening spreads.” Mortgage rates have risen faster than Treasury rates, and that difference will probably unwind as we head into 2023. There is about a 1.1% built-in decrease in mortgage rates if spreads revert to the historical mean.
Historically, housing has led the economy out of recessions. That didn’t happen after the Great Recession, but I wonder if this time around we will see an improvement in homebuilding. The need is there. The National Association of Realtors sees a 5 – 6-million-unit shortage in the United States. Homebuilders continue to struggle with shortages of labor and materials. That said, gross margins (i.e. the sale price of the house minus labor and materials) are quite healthy, so even a decline in prices should be manageable.
Global Central banks are tightening monetary policy to battle inflation via a decrease in demand. Any sort of decrease in demand should alleviate many of the supply chain issues. We have seen some improvement on supply chain issues, and even major users of logistics space like Amazon.com and FedEx are scaling back their capital expenditure plans. As demand drops, inflation should follow, which will hopefully turn around the fortunes of the housing market in late 2023 and 2024.
About the Clear Capital Home Data Index™ (HDI™) Market Report and Forecast
The Clear Capital HDI Market Report and Forecast provides insights into market trends and other leading indices for the real estate market at the national and local levels. A critical difference in the value of Clear Capital’s HDI Market Report and Forecast is the capability to provide more timely and granular reporting than nearly any other home price index provider.
Clear Capital’s HDI Methodology
• Generates the timeliest indices in patent pending, rolling quarter intervals that compare the most recent four months to the previous three months. The rolling quarters have no fixed start date and can be used to generate indices as data flows in, significantly reducing multi-month lag time that may be experienced with other indices.
• Includes both fair market and institutional (real estate owned) transactions, giving equal weight to all market transactions and identifying price tiers at a market specific level. By giving equal weight to all transactions, the HDI is truly representative of each unique market.
• Results from an address-level cascade create an index with the most granular, statistically significant market area available.
• Provides weighted repeat sales and price-per-square-foot index models that use multiple sale types, including single-family homes, multi-family homes and condominiums.
The information contained in this report and forecast is based on sources that are deemed to be reliable; however, no representation or warranty is made as to the accuracy, completeness, or fitness for any particular purpose of any information contained herein. This report is not intended as investment advice, and should not be viewed as any guarantee of value, condition, or other attribute.