

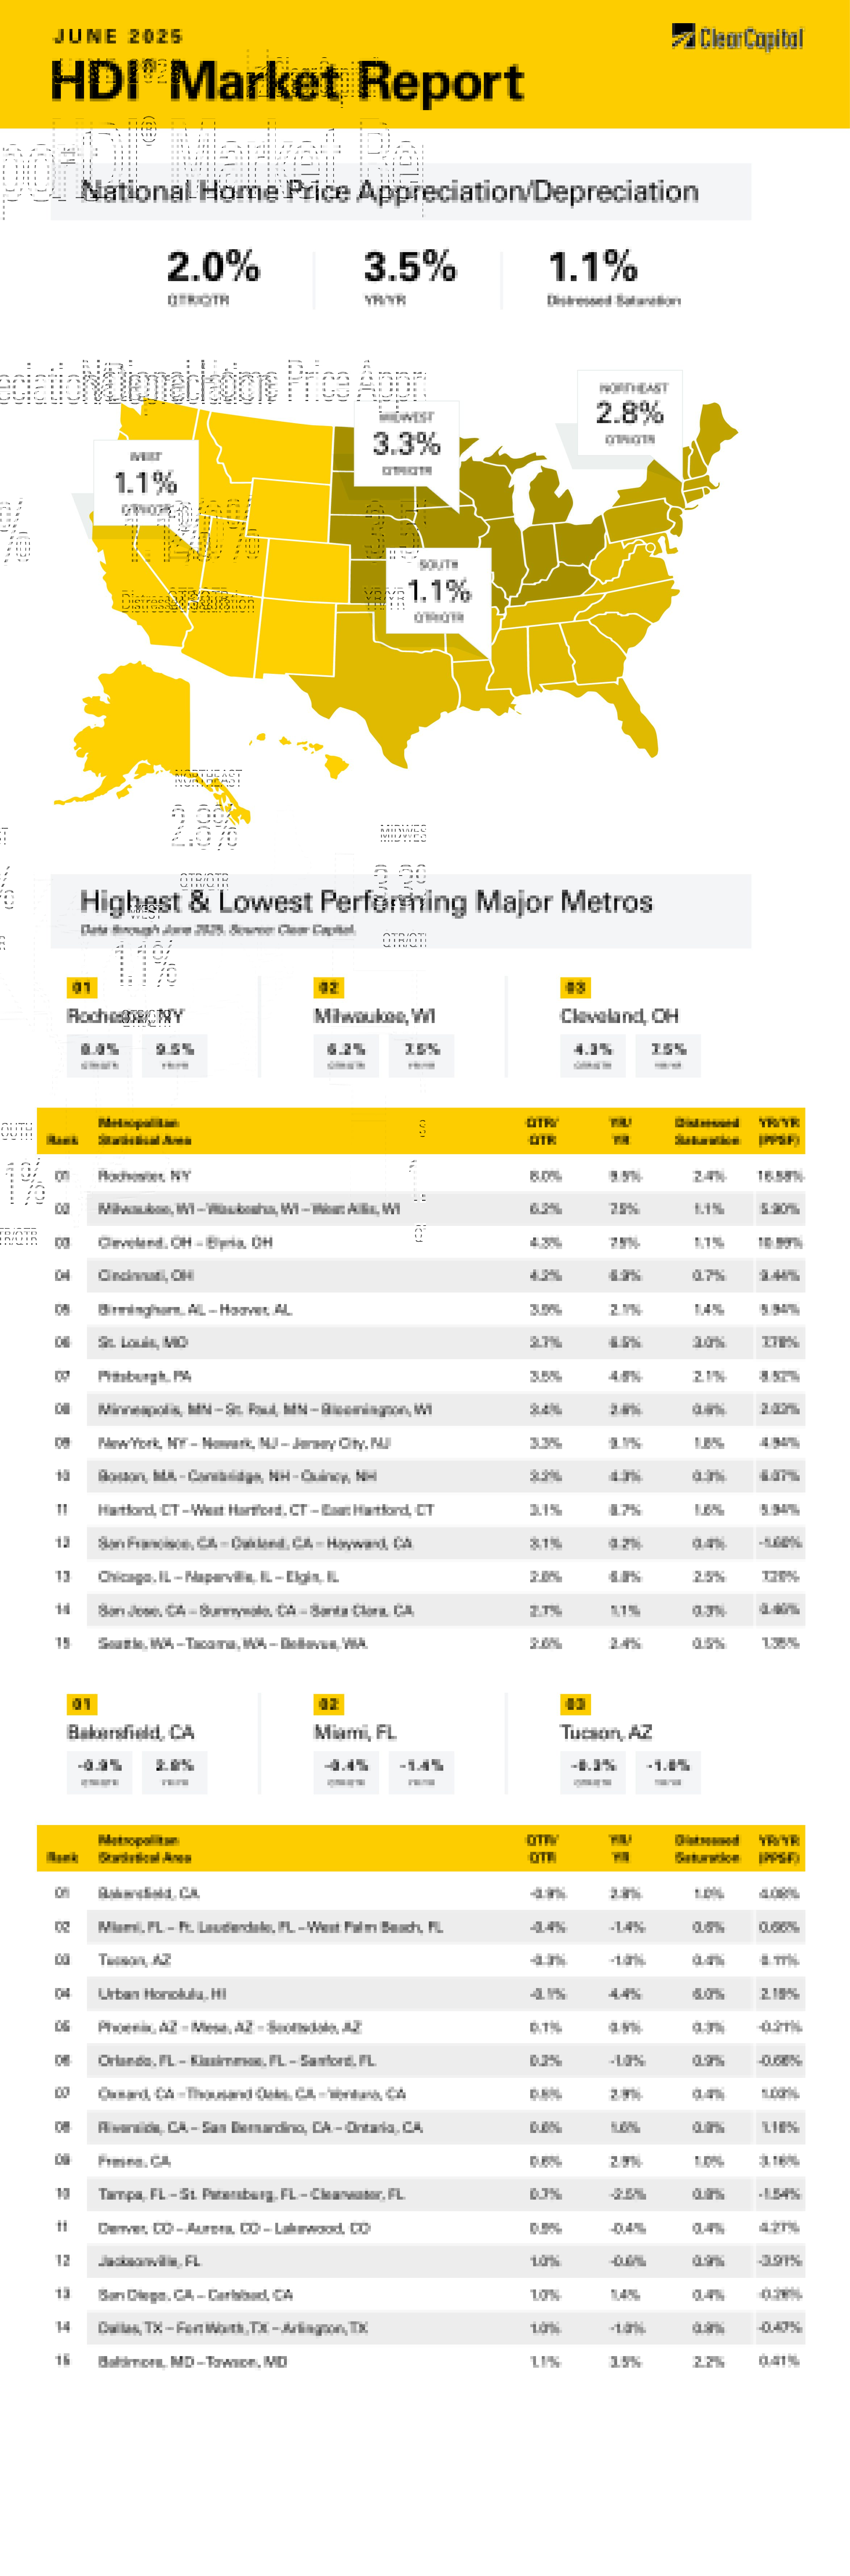
The June 2025 Clear Capital Home Data Index (HDI®) Market Report shows national quarter-over-quarter home price growth is at 2.0 percent.
Download the report, or read it below.
Commentary by Brent Nyitray of The Daily Tearsheet
Home price appreciation moderated in June, according to the Clear Capital Home Data Index. National home prices rose 2.0% on a quarterly basis and 3.5% annually. The Northeast and the Midwest continue to outperform, while the previously hot markets in Florida and the Sunbelt struggle.
The Midwest was the top performing market on a quarterly basis, rising 3.3%. Prices rose 5.4% on an annual basis. The top Midwestern metropolitan statistical area (MSA) was Milwaukee, where prices rose 6.2% on a quarterly basis and 7.5% annually. Ohio was another strong area, with Cleveland rising 4.3% quarterly and 7.5% annually. Cincinnati rose 6.9% annually. Other strong areas included St. Louis, MO and Chicago.
The Northeast was the next-best performer, with prices up 2.8% on a quarterly basis and 7.0% annually. The top performer in the Northeast was Rochester, NY, where prices rose 8.0% on a quarterly basis and 9.5% on an annual basis. The New York City metropolitan area saw continued price appreciation, rising 3.3% quarterly and 9.1% annually. Hartford, CT was another strong performer, rising 8.7% on an annual basis.
The West came in third, where prices rose 1.1% on a quarterly basis and 1.8% on an annual basis. Seattle was the top performer on an annual basis, with prices rising 2.4%, while San Jose, CA saw prices rise 1.1% and San Francisco rose 0.2%. The worst performing MSA on an annual basis was Tucson, AZ, where prices fell 1.1%.
The South continued to struggle, where prices rose 1.1% on a quarterly basis and 1.4% annually. Miami saw declining prices on a quarterly and annual basis, falling 0.4% and 1.4% respectively. Orlando, FL saw prices rise 0.2% on a quarterly basis and fall 1% annually. One bright spot was Birmingham, AL, where prices rose 3.9% on a quarterly basis and 2.1% annually.
The economy seems to be weakening, while the Fed frets about tariffs and their potential impact on inflation. At the June FOMC meeting, the committee chose to keep the Fed Funds rate at its current target range of 4.25% – 4.5% while characterizing the current state of the economy as “solid.” The FOMC dismissed the negative GDP growth in Q1 as tariff noise, although it did state that the Fed would revise policy if circumstances change. In this press conference, Jerome Powell stressed the importance of price stability and generally took a hawkish tone.
Interestingly, we started seeing some Fed speakers break ranks, with Michelle Bowman and Kevin Warsh saying that the expected tariff inflation has yet to materialize. While it is still too early to assess the effects of tariffs, as time drags on without an increase in inflation, the Fed’s stance becomes harder to justify. Absent the tariff noise, the Fed would not be tight – it would be neutral and leaning toward expansionary policy as many of the economic indicators are weaker than they first appear and inflation is within striking distance of its target.
Take the employment numbers: The economy added 139,000 jobs in May. This implies that 139,000 more people were collecting paychecks in May versus April. In fact, the number of people collecting paychecks actually fell by 700,000 in May. That gain of 139,000 was attributable to statistical adjustments concerning demographic changes. The labor force shrunk as more discouraged workers left, which is why the unemployment rate didn’t change. The labor force participation rate and the employment / population ratios both fell substantially. On paper, 139,000 new jobs and a 4.2% unemployment rate suggest strength. However, if you peek behind the curtain things are deteriorating.
First quarter GDP was revised downward from -0.2% to -0.5% on lower consumption estimates, which is not tariff noise. Retailers are noting weakness and consumer sentiment remains depressed. The Index of Leading Economic Indicators is flashing recessionary signals, and the only bright spot is the performance of the stock market. It is hard to point to any truly robust economic indicator. The Atlanta Fed revised down its Q2 GDP estimate by about 90 basis points over the past few weeks.
If the Fed cuts rates, will that trigger another rally in residential real estate? While that is always a possibility, affordability constraints make that unlikely. Much of the South is no longer cheap, the West is very expensive, and the biggest home price appreciation is coming in places that are merely catching up to the rest of the US.
Most forecasts for home price appreciation remain muted as well. The Fannie Mae Home Price Expectations Survey sees 2.9% home price appreciation this year and 2.8% next year. Zillow anticipates home prices falling about 0.7% over the next 12 months and the Mortgage Bankers Association is forecasting 1.3% growth this year and 0.3% next year.
There are major differences between today and 2021 where prices rose more than 20%. The Fed Funds rate is headed to the low 3% range, not the 0%. The Fed won’t be artificially suppressing mortgage rates via purchases of mortgage-backed securities either. We will probably see mortgage rates fall to the 6% range, not the 3.5% range. None of this should spark a return to the 8% shelter inflation we saw two years ago.
The Fed Funds futures still see a total of 3 rate cuts by the end of the year, which will help make the residential real estate market more balanced by improving affordability and reducing the magnitude of the rate lock-in effect. These cuts probably won’t have much impact on the 2025 market, but it does set us up for a better 2026.
About the Clear Capital Home Data Index (HDI®) Market Report and Forecast
The Clear Capital HDI Market Report and Forecast provides insights into market trends and other leading indices for the real estate market at the national and local levels. A critical difference in the value of Clear Capital’s HDI Market Report and Forecast is the capability to provide more timely and granular reporting than nearly any other home price index provider.
Clear Capital’s HDI Methodology
• Generates the timeliest indices in patent pending, rolling quarter intervals that compare the most recent four months to the previous three months. The rolling quarters have no fixed start date and can be used to generate indices as data flows in, significantly reducing multi-month lag time that may be experienced with other indices.
• Includes both fair market and institutional (real estate owned) transactions, giving equal weight to all market transactions and identifying price tiers at a market specific level. By giving equal weight to all transactions, the HDI is truly representative of each unique market.
• Results from an address-level cascade create an index with the most granular, statistically significant market area available.
• Provides weighted repeat sales and price-per-square-foot index models that use multiple sale types, including single-family homes, multi-family homes and condominiums.
The information contained in this report and forecast is based on sources that are deemed to be reliable; however, no representation or warranty is made as to the accuracy, completeness, or fitness for any particular purpose of any information contained herein. This report is not intended as investment advice, and should not be viewed as any guarantee of value, condition, or other attribute.