

The September 2022 Home Data Index™ (HDI™) Market Report shows national quarter-over-quarter (QoQ) home price growth is at 4.2 percent.
Download the report, or read it below.
Commentary by Brent Nyitray of The Daily Tearsheet
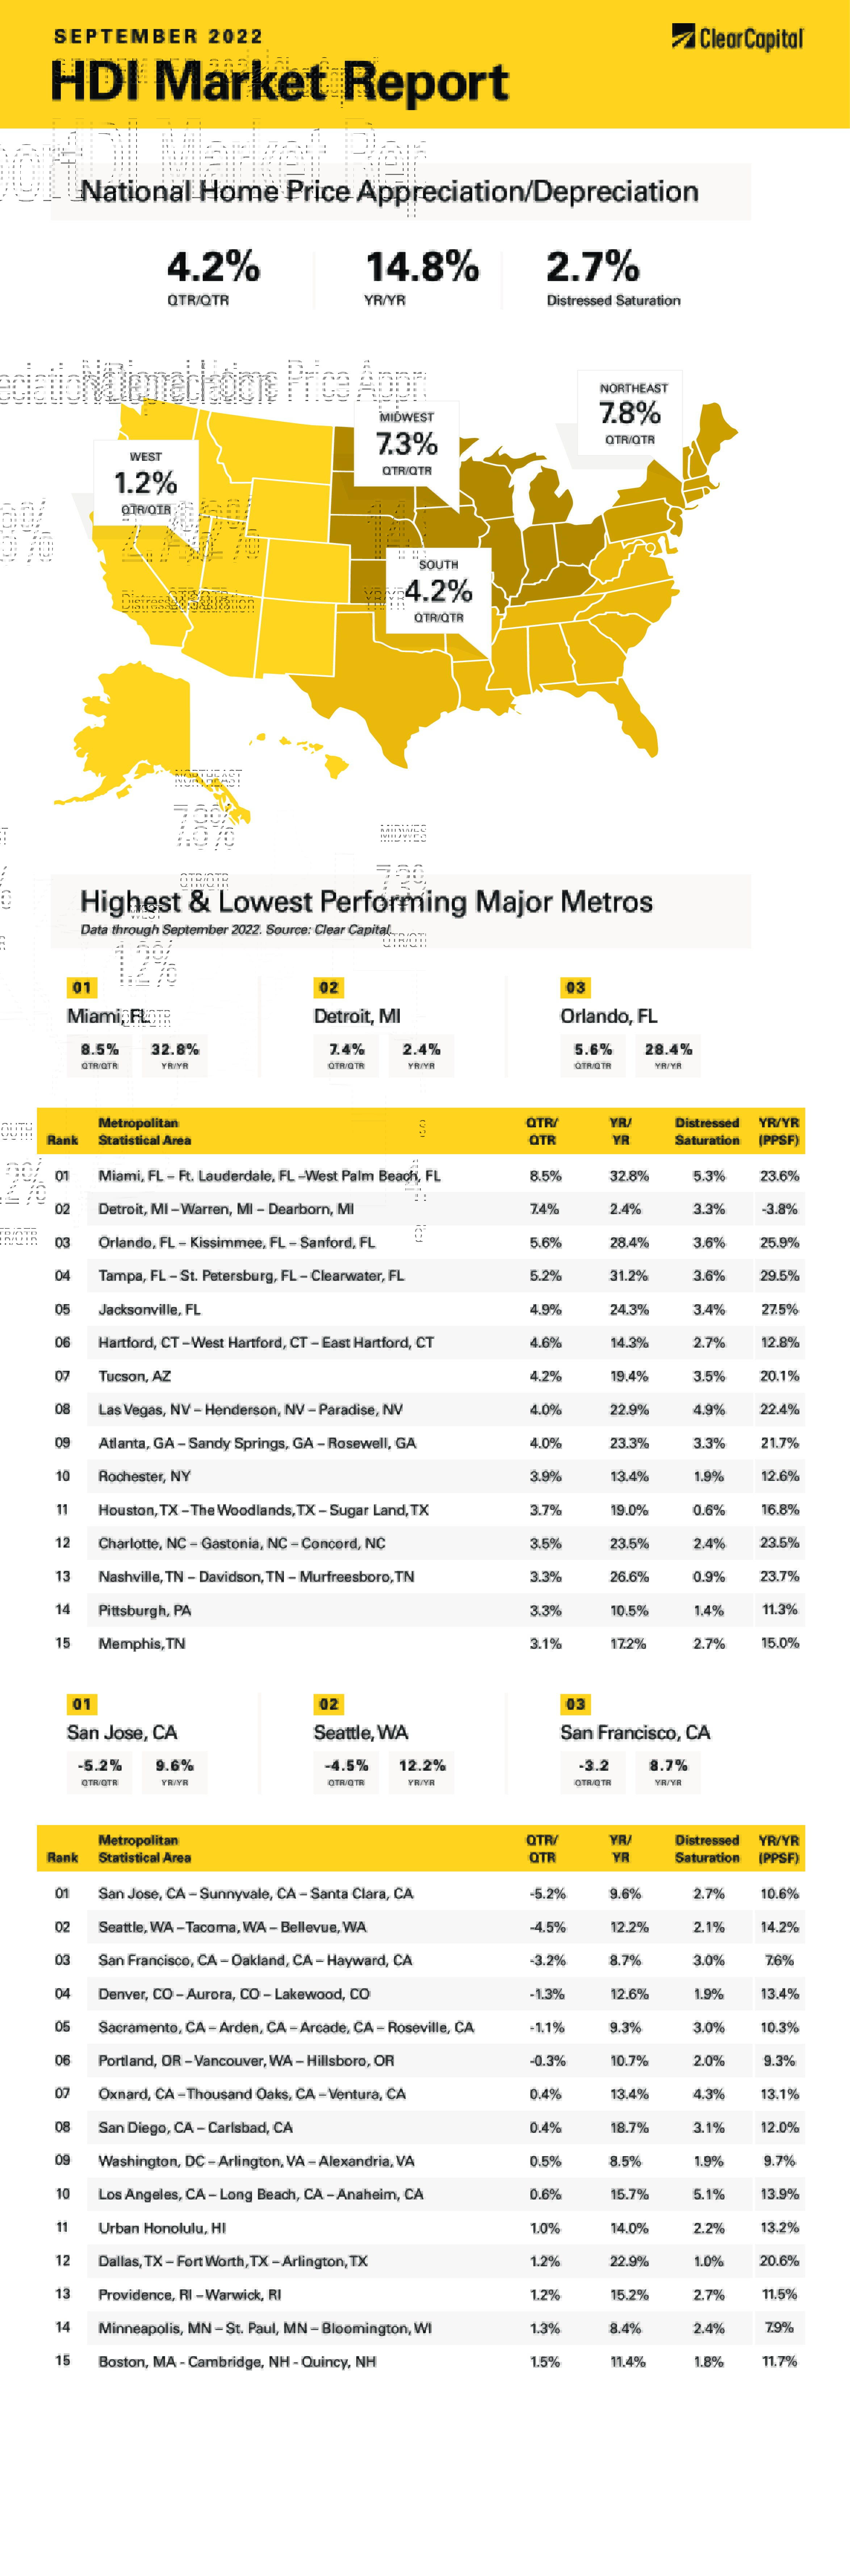
Home price appreciation cooled again in September as the Clear Capital Home Data Index rose 4.2% quarter-over-quarter (QoQ) and 14.8% on a year-over-year (YoY) basis. This compares to an 7.4% QoQ increase and a 17% YoY increase in August. Every region reported home price appreciation, and the hottest region remains Florida.
Interestingly, the Northeast again had the fastest quarterly growth at 7.8% and the fastest annual growth at 16.9%, with Hartford (up 14.3%) and Rochester (up 13.4%) leading the way. This might be a catch-up situation as the Northeast has been a national laggard since the real estate bubble burst in 2006. Given the anecdotal evidence that people are leaving the New York City area for cheaper locations, you would think the Northeast would be suffering.
The South came in second, which grew 4.2% QoQ and 17.8% YoY last month. Most of the top 15 MSAs were in the South, with Miami rising 33%, Tampa rising 31%, and Orlando increasing 28%. The South has been a stalwart performer over the past several quarters and is supposedly picking up the people who are leaving the Northeast.
The West came in next, where prices rose 13.5% and only 1.2% on a YoY basis. Tucson remained strong, with 19% home price appreciation. Interestingly, the biggest quarterly laggards included San Jose (down 5.2%), Seattle (down 4.5%), San Francisco (down 3.2%) and Denver (down 1.3%). All of these MSAs were up on a YoY basis, however these quarterly declines are quite large.
Finally, the Midwest saw a 9.9% increase in prices. Interestingly, the quarterly growth rate was 7.3%, which implies price appreciation is accelerating, similar to the Northeast. Detroit saw a sizable 7.4% increase in quarterly price appreciation, however it was barely positive on a YoY basis. The only other laggard was Minneapolis, where prices rose 1.3% QoQ and 8.4% YoY.
As the Federal Reserve continues to hike rates, the economy is beginning to show signs of weakness. Economic bellwether FedEx reported disappointing earnings, and the stock market is sending worrying signals about third quarter earnings. The first and second quarter GDP numbers were negative, and the Atlanta Fed’s GDP Now forecast sees third quarter GDP as barely positive.
When the Fed hiked rates in September, it took up its estimates of inflation, downgraded its estimates of growth, and bumped up its forecast in the Fed Funds rate. The yield curve continues to invert, with the 10-year yield well below the 2-year yield. Historically, a yield curve inversion has been a recessionary indicator. Ultimately the only thing holding the economy together is a strong labor market.
What does this mean for housing? As we saw in the index, some of the hottest markets in California have begun to see declines. We are hearing more anecdotal stories of weakening markets as would-be buyers are squeezed by rising rates and prices. In fact, home sales are falling through as borrowers who were pre-qualified to buy a home end up being unable to qualify at higher rates. Some of the declines are expected given the seasonal nature of the housing market, but the Fed might finally be getting its wish to cool the housing market.
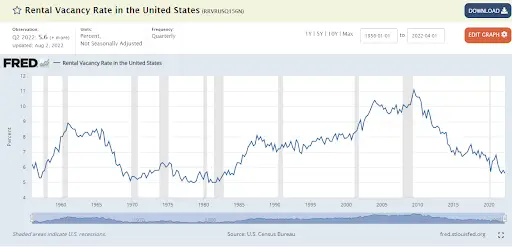
For real estate professionals, the market remains strong. Rental vacancies are at the lowest levels since the mid-1980s and rental inflation tends to lag home price appreciation by about 21 months. So even if home prices do take a breather, rents should continue to rise.
The rise in interest rates is not only a US phenomenon. The German Bund (basically Germany’s equivalent to a Treasury) had a negative yield six months ago. It is now well above 2%. The Bank of England has begun to intervene in the bond market in order to stabilize its financial system. Signs of stress are beginning to show, and if anything gets the Fed to take its foot off the brakes, that will do it.
Ultimately, if you believe the Fed Funds futures, the tightening cycle should wrap up towards the end of the year. The futures see an end-of-year Fed Funds rate of 4.25% – 4.5%, and they see a December 2023 rate of the same amount. The end of the tightening cycle should make a more favorable environment for housing.
A big driver will be mortgage rates, and currently they are high relative to Treasuries because the market fears the Fed will dump its mortgage-backed securities portfolio onto the market. While Jerome Powell said at his press conference that nothing is imminent, a cloud hangs over the market. Once the Fed finishes its tightening cycle, interest rate volatility should decrease, which would be conducive to lower mortgage rates and ultimately real estate prices.
Historically, housing has led the economy out of recession. It didn’t happen in 2008 or 2020 for obvious reasons, but maybe this time around we will see the spate of building everyone has been waiting for.
About the Clear Capital Home Data Index™ (HDI™) Market Report and Forecast
The Clear Capital HDI Market Report and Forecast provides insights into market trends and other leading indices for the real estate market at the national and local levels. A critical difference in the value of Clear Capital’s HDI Market Report and Forecast is the capability to provide more timely and granular reporting than nearly any other home price index provider.
Clear Capital’s HDI Methodology
• Generates the timeliest indices in patent pending, rolling quarter intervals that compare the most recent four months to the previous three months. The rolling quarters have no fixed start date and can be used to generate indices as data flows in, significantly reducing multi-month lag time that may be experienced with other indices.
• Includes both fair market and institutional (real estate owned) transactions, giving equal weight to all market transactions and identifying price tiers at a market specific level. By giving equal weight to all transactions, the HDI is truly representative of each unique market.
• Results from an address-level cascade create an index with the most granular, statistically significant market area available.
• Provides weighted repeat sales and price-per-square-foot index models that use multiple sale types, including single-family homes, multi-family homes and condominiums.
The information contained in this report and forecast is based on sources that are deemed to be reliable; however, no representation or warranty is made as to the accuracy, completeness, or fitness for any particular purpose of any information contained herein. This report is not intended as investment advice, and should not be viewed as any guarantee of value, condition, or other attribute.