

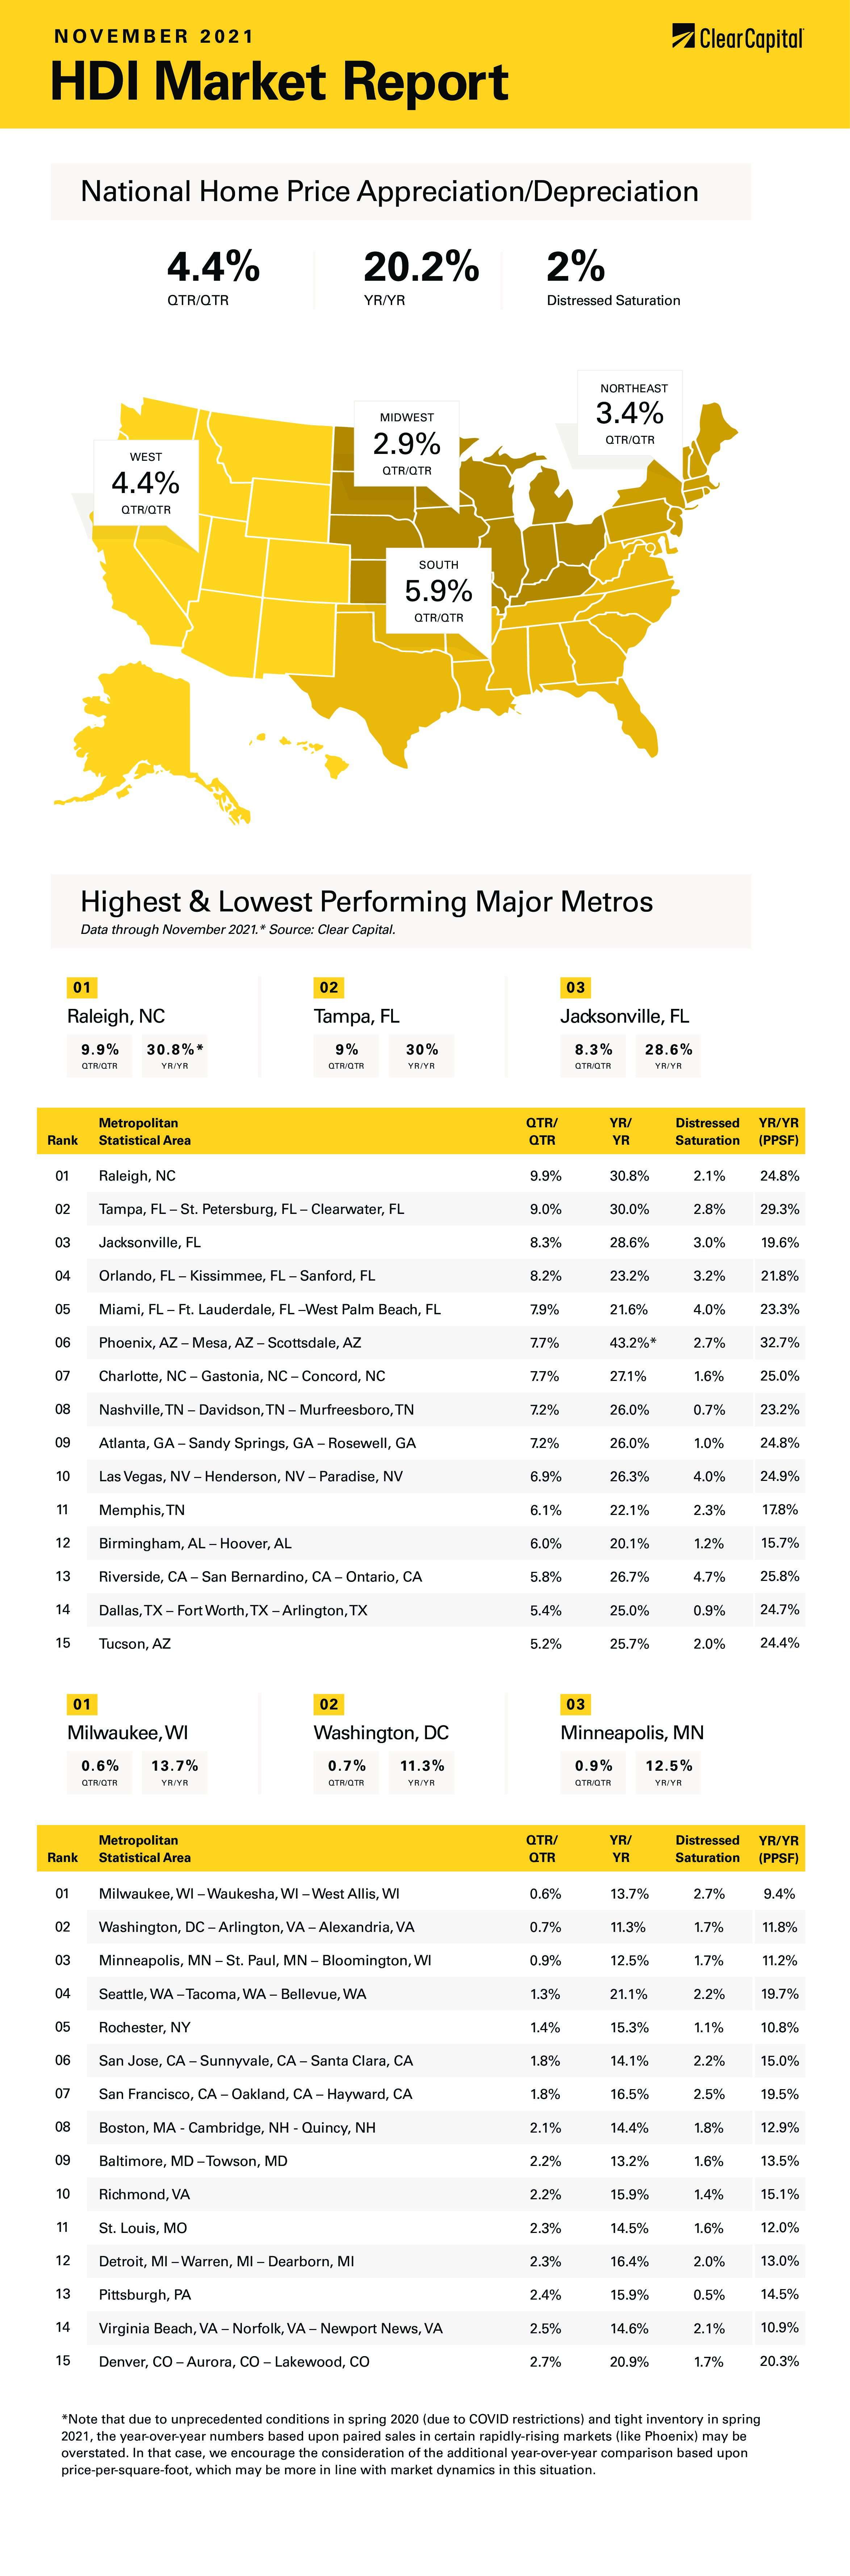
The November 2021 Home Data Index™ (HDI™) Market Report shows national quarter-over-quarter (QoQ) home price growth is at 4.4 percent.
Download the report, or read it below.
* Note that due to unprecedented conditions in spring 2020 (due to COVID restrictions) and tight inventory in spring 2021, the year-over-year numbers based upon paired sales in certain rapidly-rising markets (like Phoenix) may be overstated. In that case, we encourage the consideration of the additional year-over-year comparison based upon price-per-square-foot, which may be more in line with market dynamics in this situation.
Commentary by Brent Nyitray of The Daily Tearsheet
Real estate prices continued their ascent last month as the Clear Capital Home Data Index rose 4.4% quarter-over-quarter (QoQ) and 20.2% on a year-over-year (YoY) basis. Every region reported home price appreciation; but some of the big increases are beginning to slow down. We are also seeing the fastest-growing metropolitan statistical areas (MSAs) concentrated in a few regions and states.
The fastest growing region was the West, which grew 24% last month. Again, Phoenix was again the leader, with prices rising 43% YoY. On a price-per-square foot basis, prices rose 33%, which is another data point showing this market is still experiencing rapid growth.
The South came in second, with a slew of MSAs in the top 10. Raleigh, North Carolina came in first, where prices rose 31% YoY. Florida had quite a few, with Tampa, Jacksonville, Orlando and Miami all posting more than 20% gains.
The Northeast came in next, where prices rose 17% YoY. That said, none of the Northeast MSAs made the top 15.
Finally, the Midwest saw a 16% increase in prices. Since the top 15 MSAs were dominated by the South and West, no Midwestern MSAs made the list. The slowest MSA went to Minneapolis, where prices rose “only” 12%. Milwaukee was also a laggard, with prices rising 14%.
In his testimony in front of Congress, Fed Chairman Jerome Powell mused that it might be time to retire the word “transitory” from the Central Bank’s vernacular when it comes to describing inflation. It is a recognition that the recent rise in prices is driven by more than just supply-chain snags.
Professionally managed capital is also making this bet. If you are a macro hedge fund, you are probably long commodities and short treasuries. That’s kind of the go-to trade when you think of how to play inflation. Things may be changing, however. Although you probably haven’t noticed at the gas station yet or in your utility bills yet, energy prices have taken a beating over the past month. Since November 1, oil is down 21%. Meanwhile the 10 -year bond yield is down 11 basis points or so. Which means the macro guys are taking pain on both sides of the trade.
It isn’t just oil – natural gas is down 21%. One of the big building blocks for inflation – energy prices – is falling. Even agricultural futures look like they have topped out. I am sure it is a welcome sign to the Fed as it looks like the consumer will finally get some relief.
Wages, on the other hand continue to rise, and a record number of people quit their jobs in September. The quits rate also hit 3%, a record. The labor market is still wrestling with shortages, which we heard about in the latest ISM Reports. All of this points to wage inflation going forward. And while the Fed isn’t wild about inflation to begin with, they will take wage-driven inflation over commodity-driven inflation any day of the week.
That said, the inflation indices have only begun to reflect the big move in real estate that have been going on for the past year. Real estate prices hit the indices with a 12-to-18-month lag, although the “owner’s equivalent rent” is more or less just an academic construct. So, expect the headline inflation numbers will be elevated for a while. Which is why he figured it was time for the “transitory” description to go.
The Fed is expected to announce that it is doubling the pace of tapering – which should be bearish for asset prices, at least at the margin. How about real estate? Did Zillow ring the bell at the top of the market? Flippers in some markets might have to sit on inventory for a while. But investors are probably in good shape.
While the torrid pace last year’s price appreciation was clearly unsustainable, so far, we aren’t seeing much movement in the way of supply and demand. First time homebuyers are being squeezed by professionally managed money; however housing starts are still stuck around 1.5 million, the average going back to 1959. Meanwhile the Millennial Generation is reaching first-time homebuyer stage. Fast money may come and go, but the fundamentals are there for a multi-year housing boom.
 About the Clear Capital Home Data Index™ (HDI™) Market Report and Forecast
The Clear Capital HDI Market Report and Forecast provides insights into market trends and other leading indices for the real estate market at the national and local levels. A critical difference in the value of Clear Capital’s HDI Market Report and Forecast is the capability to provide more timely and granular reporting than nearly any other home price index provider.
Clear Capital’s HDI Methodology
• Generates the timeliest indices in patent pending, rolling quarter intervals that compare the most recent four months to the previous three months. The rolling quarters have no fixed start date and can be used to generate indices as data flows in, significantly reducing multi-month lag time that may be experienced with other indices.
• Includes both fair market and institutional (real estate owned) transactions, giving equal weight to all market transactions and identifying price tiers at a market specific level. By giving equal weight to all transactions, the HDI is truly representative of each unique market.
• Results from an address-level cascade create an index with the most granular, statistically significant market area available.
• Provides weighted repeat sales and price-per-square-foot index models that use multiple sale types, including single-family homes, multi-family homes and condominiums.
The information contained in this report and forecast is based on sources that are deemed to be reliable; however, no representation or warranty is made as to the accuracy, completeness, or fitness for any particular purpose of any information contained herein. This report is not intended as investment advice, and should not be viewed as any guarantee of value, condition, or other attribute.