

The March 2025 Home Data Index (HDI®) Market Report shows national quarter-over-quarter home price growth is at 0 percent.
Download the report, or read it below.
Commentary by Brent Nyitray of The Daily Tearsheet
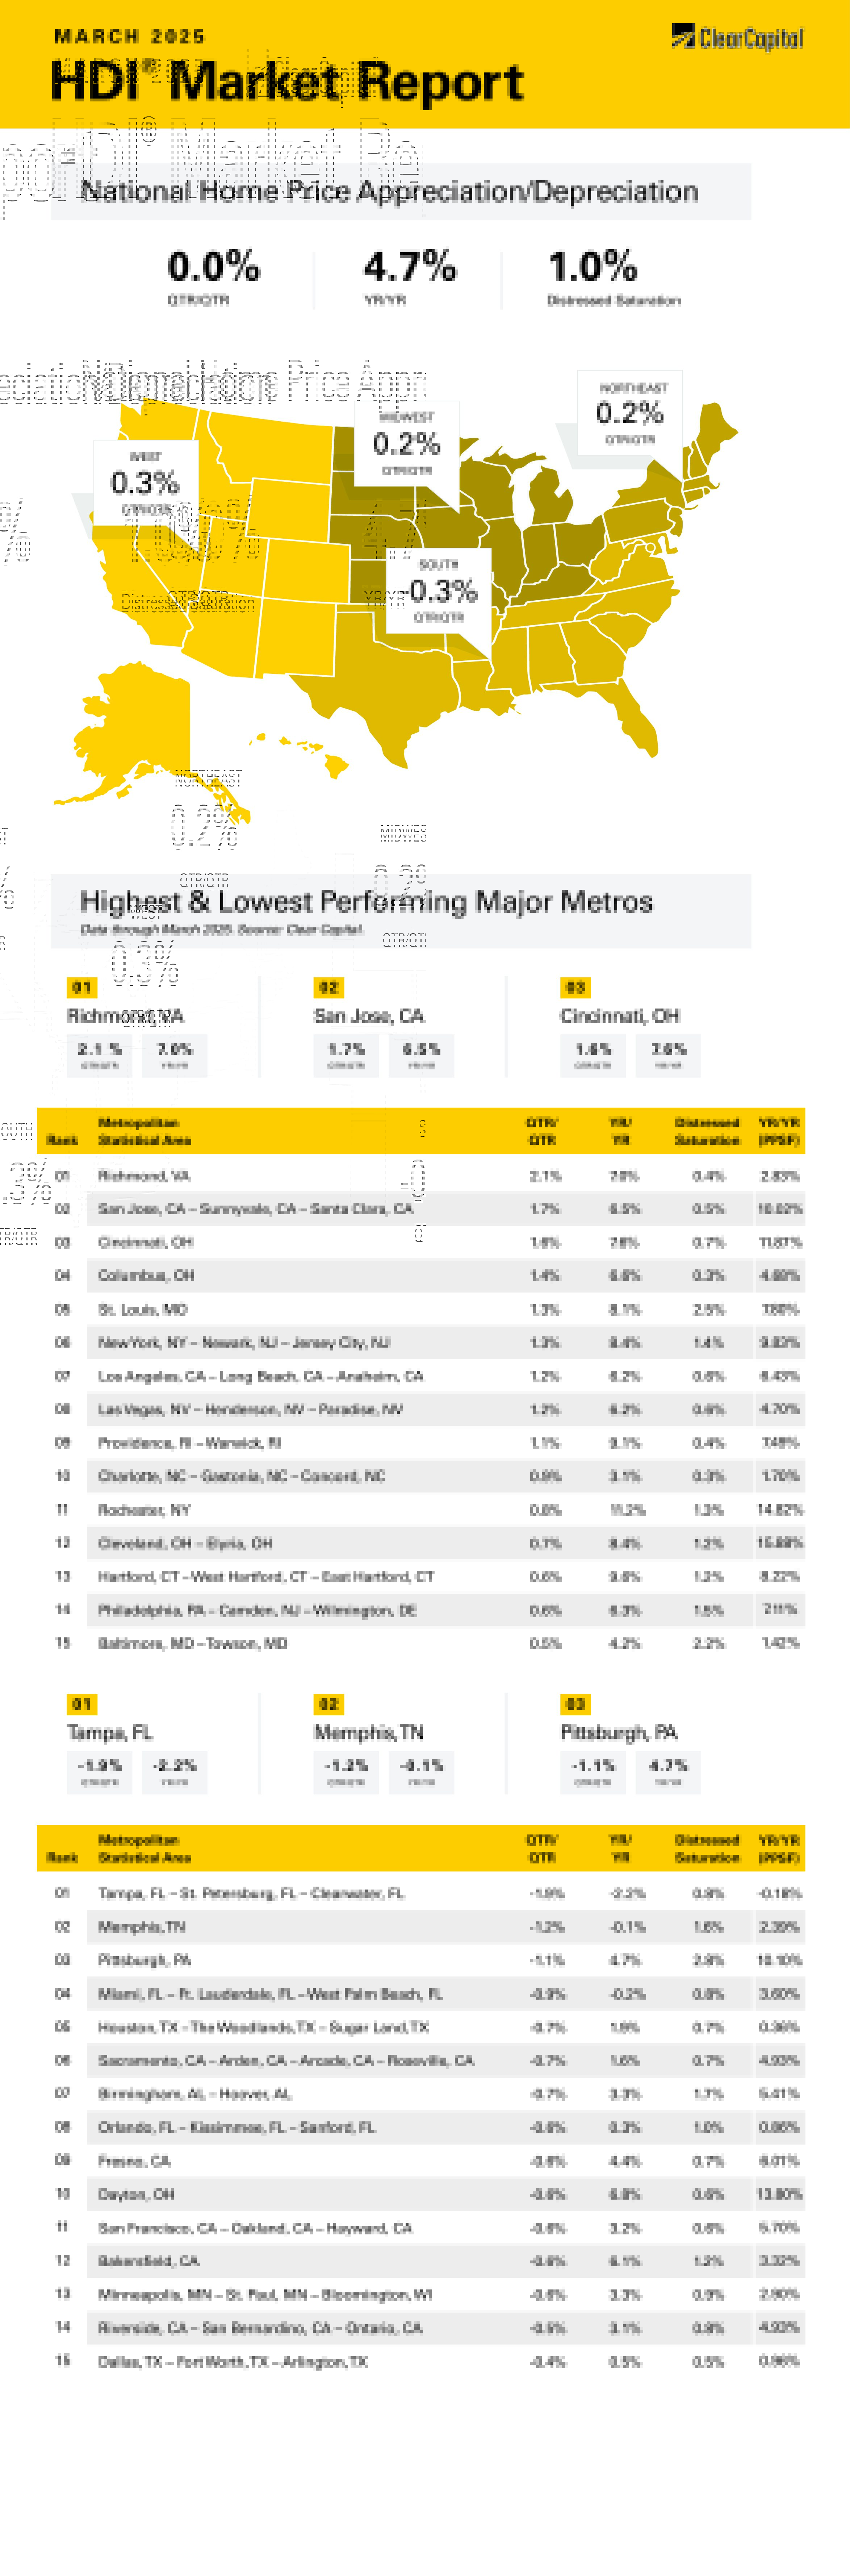
Home prices were flat quarter-over-quarter (QoQ) in March, according to the Clear Capital Home Data Index. On a year-over-year (YoY) basis, prices rose 4.7%. All regions rose on a YoY basis; however, the South fell on a QoQ basis.
The Northeast performed the best on a YoY basis, increasing 7.2% YoY and 0.2% QoQ. The top Northeast metropolitan statistical area (MSA) was the New York City metro area where prices rose 1.3% QoQ and 8.4% YoY. Rochester, NY rose 0.8% QoQ and 11.2% YoY, and Providence rose 1.1% QoQ and 9.1% YoY. No Northeast MSAs hit the bottom 15.
The Midwest was the next best performing region on a year-over-year basis, where prices rose 0.2% month-over-month and 6.5% year-over-year. Cincinnati was the top Midwestern MSA where prices rose 1.6% QoQ and 7.6% YoY. Columbus, OH was next at 1.4% QoQ and 6.6% YoY. Interestingly, Dayton, OH was one of the worst performers in the Midwest on a QoQ basis where prices fell 0.6% QoQ but rose 6.8% YoY. Minneapolis also struggled where prices fell 0.6% QoQ and rose 3.3% YoY.
The West was the third best performing region, where prices rose 0.3% QoQ and 3.8% YoY. The best performing MSA was San Jose, CA where prices rose 1.7% QoQ and 6.5% YoY. The Los Angeles MSA was the next best performer where prices rose 1.2% QoQ and 6.2% YoY. Las Vegas was third, where prices rose 1.2% QoQ and 6.2% YoY. The worst Western MSA was Sacramento, CA where prices fell 0.7% QoQ and increased 1.6% YoY.
The South was the worst-performing MSA where prices fell 0.3% QoQ and rose 2.7% YoY. Richmond, VA was the top performer in the South, where prices rose 2.1% QoQ and 7.0% YoY. Charlotte, NC was the next best area, where prices rose 0.9% QoQ and 3.1% YoY. The worst-performing MSA was Tampa, FL where prices fell 1.9% QoQ and 2.2% YoY. Memphis, TN also struggled, where prices fell 1.2% QoQ and 0.1% YoY.
______________________________________________________________________
The tariff announcement is still relatively fresh, and we are in the early days of determining the impact tariffs will have on the economy. The initial (and most visible reaction) has been in the stock market, where prices have fallen about 10% since the tariffs were announced. The stock market is pricing in a protracted trade war, or at least a significant risk of one.
Free trade is one of the few free lunches in economics, however there will be winners and losers. The biggest beneficiaries will probably be manufacturing workers in the United States, and the biggest losers will be consumers in general. That said, the free lunch analysis of trade doesn’t consider the increased risk of extended supply chains as we saw during the pandemic years. As with anything in economics, theory never captures everything.
It is too early to determine how this whole thing will shake out. China has imposed increased tariffs on US goods, but most of our partners haven’t responded yet. The economic effects of these tariffs will be highly dependent on how our trading partners react. Despite Jerome Powell’s comments that tariffs might be inflationary, the Fed Funds futures have increased their forecast from 3 to 4 rate cuts this year. If the stock market decline gets materially worse, the Fed will be under intense pressure to cut rates. Monetary policy is still restrictive, and the Fed will want to get to a neutral posture at a minimum.
In addition, commodity prices are falling. Here’s why: About 33% of the US exports to China are commodities – primarily oil and food. If the US sells less food and energy to China, that increases supply in the US, which pushes down prices. This is good news, as no American is going to complain if prices fall at the gasoline pump or the grocery store. Falling food and energy prices are good for inflation, not bad.
Bond yields fell on the tariff announcement, presumably on the flight-to-safety trade. Yields have returned to pre-announcement levels, but things remain volatile. It is too early to say if bond yields have adjusted to the tariffs.
There will be all sorts of offsetting reactions to tariffs, and it will take some time for us to figure out the net effect. If the trade war begins to escalate, don’t be surprised if Congress passes legislation to take over tariff setting (which is where it belongs in the first place). First quarter earnings conference calls will be interesting to say the least.
How will tariffs affect housing?
The National Association of Home Builders estimates that tariffs will increase the cost of a new home by $9,200. Given the median new home price is $414,800, the tariff impact will be something like 2.2%. A 2.2% increase in the average monthly payment is probably not going to shift sentiment all that much, and if mortgage rates fall below 6.4%, the whole thing is a wash.
The 10% decline in the S&P 500 will probably impact prices more at the high end of the market than at the low end – luxury homebuyers have a lot of wealth tied up in the stock market while the first-time homebuyer has a long enough investment horizon that the market decline shouldn’t affect buying decisions. Even if their down payment was invested in the stock market, there are limited down payment mortgage options which require only 2.5%. In fact, the biggest problem in the housing market over the past several years – limited inventory – seems to be abating, as the National Association of Realtors estimates housing inventory is up 17% compared to a year ago. As rates fall, the rate lock-in effect becomes less important.
Bottom line: Provided the price impact on new home construction is in line with the NAHB estimates and mortgage rates don’t rise from here, the tariff impact on housing will be negligible.
About the Clear Capital Home Data Index (HDI®) Market Report and Forecast
The Clear Capital HDI Market Report and Forecast provides insights into market trends and other leading indices for the real estate market at the national and local levels. A critical difference in the value of Clear Capital’s HDI Market Report and Forecast is the capability to provide more timely and granular reporting than nearly any other home price index provider.
Clear Capital’s HDI Methodology
• Generates the timeliest indices in patent pending, rolling quarter intervals that compare the most recent four months to the previous three months. The rolling quarters have no fixed start date and can be used to generate indices as data flows in, significantly reducing multi-month lag time that may be experienced with other indices.
• Includes both fair market and institutional (real estate owned) transactions, giving equal weight to all market transactions and identifying price tiers at a market specific level. By giving equal weight to all transactions, the HDI is truly representative of each unique market.
• Results from an address-level cascade create an index with the most granular, statistically significant market area available.
• Provides weighted repeat sales and price-per-square-foot index models that use multiple sale types, including single-family homes, multi-family homes and condominiums.
The information contained in this report and forecast is based on sources that are deemed to be reliable; however, no representation or warranty is made as to the accuracy, completeness, or fitness for any particular purpose of any information contained herein. This report is not intended as investment advice, and should not be viewed as any guarantee of value, condition, or other attribute.