

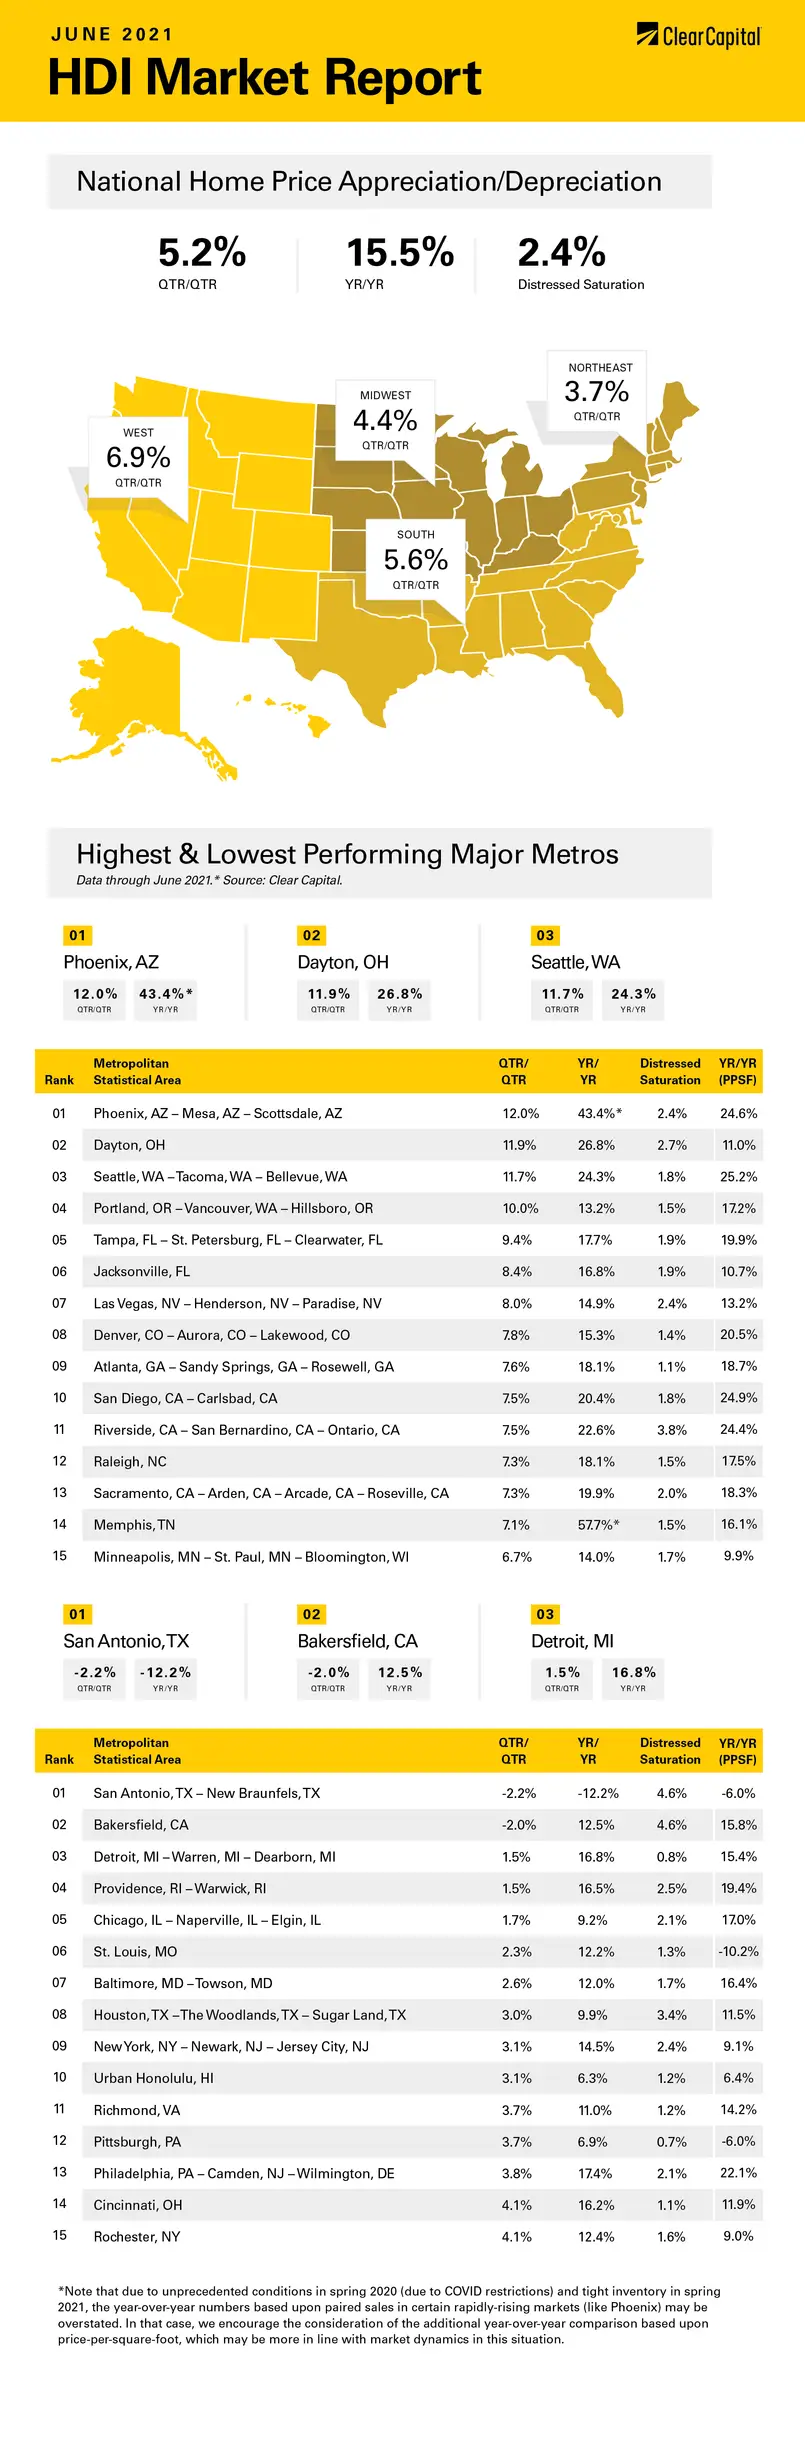
The June 2021 Home Data Index™ (HDI™) Market Report shows national quarter-over-quarter (QoQ) home price growth is at 5.2 percent.
Download the report, or read it below.
* Note that due to unprecedented conditions in spring 2020 (due to COVID restrictions) and tight inventory in spring 2021, the year-over-year numbers based upon paired sales in certain rapidly-rising markets (like Phoenix) may be overstated. In that case, we encourage the consideration of the additional year-over-year comparison based upon price-per-square-foot, which may be more in line with market dynamics in this situation.
Commentary by Brent Nyitray of The Daily Tearsheet
Home prices rose 15.5% nationally in June on a year-over-year (YoY) basis. On a quarter-over-quarter (QoQ) basis, they increased 5.2%. Home prices grew in every region; however, price appreciation on a YoY basis was strongest in the West and slowest in the South.
The COVID-19 lockdowns of a year ago depressed home sales which at least partially explains the rapid price appreciation numbers we’re seeing today. Small sample sizes can introduce a lot of noise into the data, and that’s probably going on here. According to the latest National Association of Realtors (NAR) Existing Homes Sales report, May sales were up 44% on a YoY basis, which shows the real estate market of a year ago was really a special case and many of these YoY increases should have an asterisk next to them. We included some price-per-square-foot data as well, which gives additional perspective.
The West accounted for half of the top 10 performing MSAs, with prices rising 6.9% on QoQ basis and 19.4% on a YoY basis. The Phoenix, AZ MSA rose the most, increasing 43% YoY. While this result might be distorted by COVID issues, the price-per-square-foot data shows prices rising 25% YoY, which supports the data. Phoenix, AZ is seeing an inflow of people leaving California’s high cost of living, and bidding wars are common. In other Western MSAs, Seattle, WA rose 24% YoY and Riverside, CA rose 23% YoY.
In the South, prices rose 5.6% QoQ and increased 13.6% on an annual basis. Memphis, TN takes the prize overall with prices rising a torrid 58% YoY. On a price-per-square-foot basis, prices were up 16% YoY, which is probably more representative of what’s really going on. The Atlanta, GA, Raleigh, NC, and Tampa, FL MSAs all rose 18% YoY.
In the Midwest, prices rose 4.4% on a QoQ basis and 14.7% on an annual basis. Dayton, OH was the strongest MSA, with prices rising 27% YoY. Minneapolis, MN was also a top performer, posting a 14% YoY increase.
The Northeast saw a 3.7% QoQ increase; however, it was the second fastest region on a YoY basis, with prices rising 15.9%. The New York, NY MSA saw a 15% YoY increase while Philadelphia, PA rose more than 17% YoY and Providence rose 16.8% YoY. Overall, the Northeast and the Mid-Atlantic have been laggards since real estate bottomed in 2012. This is probably due to people leaving the New York City area for states with cheaper costs of living as well as growth in the Mountain and West Coast MSAs.
According to NAR, there is a near-record low supply of homes for sale, and homes on market lasted only 17 days. The median home price rose 24% on a YoY basis. This increase isn’t comparable to the matched sale number reported by our HDI Market Report, but it’s another data point supporting the massive price appreciation we’re seeing.
With asset prices rising across the board and Fed-driven low borrowing costs, we’re seeing a flood of capital entering the real estate rental market. Private equity firms such as KKR and Blackstone are raising capital for single-family rental strategies. Fast money is pouring into the space which will intensify a bidding war for investor properties. First-time homebuyers are going to find themselves with formidable competition for the foreseeable future.
Separately, the Supreme Court just ruled that the head of the Federal Housing Finance Agency (FHFA) can be fired by the President. President Biden promptly fired Trump nominee Mark Calabria, who worked to release government sponsored entities (GSEs) Fannie Mae and Freddie Mac from government control. Biden replaced Calabria with Sandra Thompson, who “better reflects the administration’s values.” That statement presumably refers in part to the restrictions on the GSEs which were imposed in the final days of the Trump Administration.
These restrictions included limits on investment properties, first-time homebuyer / lower-income programs, and caps on how much an individual lender could sell to them. The net effect was to restrict the number of loans that can be guaranteed by the government. These limits can all be reversed with a simple letter, provided Treasury Secretary Janet Yellen is on board.
Calabria’s caps were intended to revive the private label securitization market, which it did. Regardless of what happens with the caps, the current expansion of private capital into the mortgage market is probably here to stay. If the private label market encourages development of an insurance program that can compete with GSE pricing, then you might see competition between Fannie / Freddie and the Street, something that hasn’t existed for 15 years. This would push mortgage rates down further.
It’s hard to see how this is anything but bullish for house prices going forward.
About the Clear Capital Home Data Index™ (HDI™) Market Report and Forecast
The Clear Capital HDI Market Report and Forecast provides insights into market trends and other leading indices for the real estate market at the national and local levels. A critical difference in the value of Clear Capital’s HDI Market Report and Forecast is the capability to provide more timely and granular reporting than nearly any other home price index provider.
Clear Capital’s HDI Methodology
• Generates the timeliest indices in patent pending, rolling quarter intervals that compare the most recent four months to the previous three months. The rolling quarters have no fixed start date and can be used to generate indices as data flows in, significantly reducing multi-month lag time that may be experienced with other indices.
• Includes both fair market and institutional (real estate owned) transactions, giving equal weight to all market transactions and identifying price tiers at a market specific level. By giving equal weight to all transactions, the HDI is truly representative of each unique market.
• Results from an address-level cascade create an index with the most granular, statistically significant market area available.
• Provides weighted repeat sales and price-per-square-foot index models that use multiple sale types, including single-family homes, multi-family homes and condominiums.
The information contained in this report and forecast is based on sources that are deemed to be reliable; however, no representation or warranty is made as to the accuracy, completeness, or fitness for any particular purpose of any information contained herein. This report is not intended as investment advice, and should not be viewed as any guarantee of value, condition, or other attribute.