

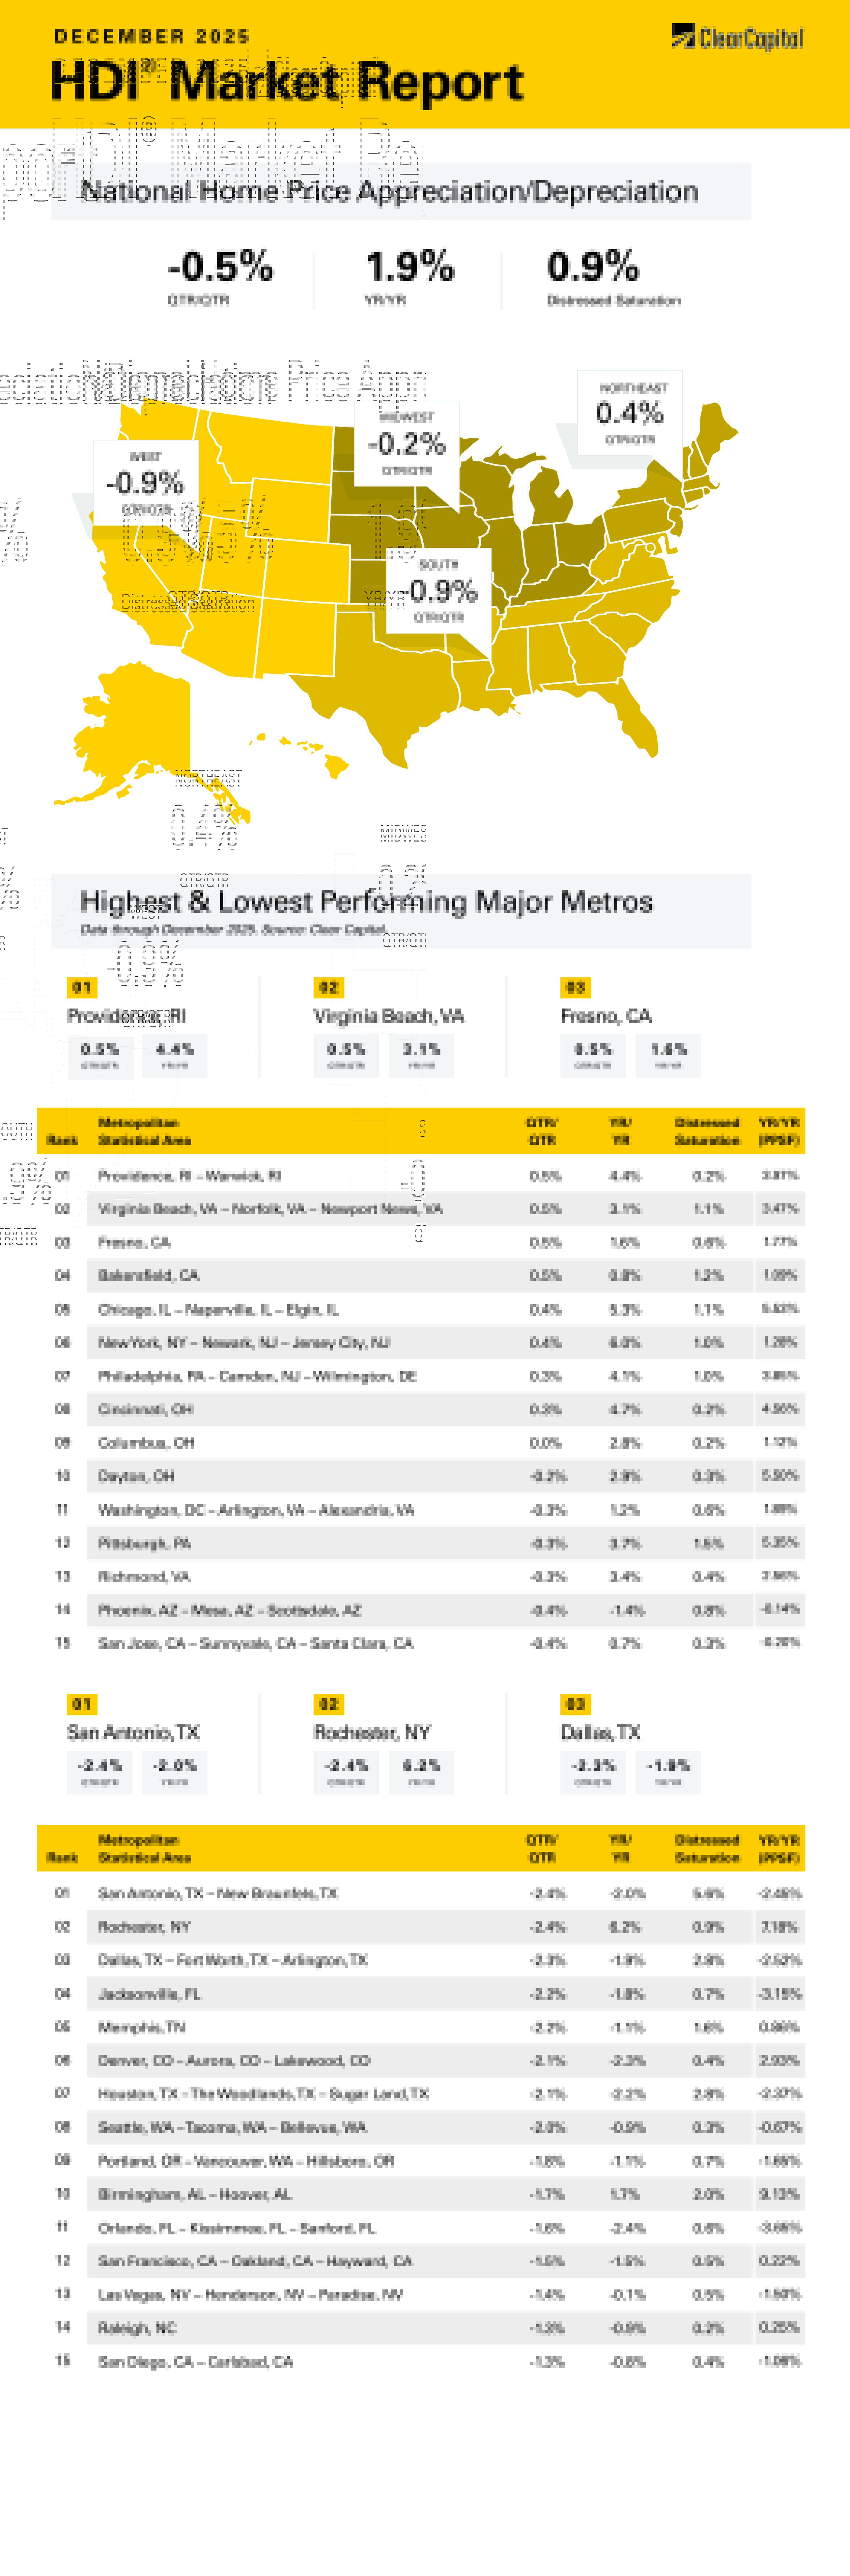
The December 2025 Clear Capital Home Data Index (HDI®) Market Report shows national quarter-over-quarter home price growth is at -0.5 percent.
Download the report, or read it below.
Commentary by Brent Nyitray of The Daily Tearsheet
Home price appreciation decelerated in December, according to the Clear Capital Home Data Index. Nationally, home prices fell 0.5% on a quarterly basis and rose 1.9% annually. The Northeast is still exhibiting quarterly and annual growth, while the West, Midwest and the South are negative on a quarterly basis. Of the top 15 Metropolitan Statistical Areas (MSAs), eight experienced positive quarterly growth, one experienced no growth, and six had negative growth.
The Northeast was the top market, rising 0.4% quarterly and 5.0% annually. The top Northeastern MSA was Providence, RI, where prices grew 0.5% on a quarterly basis and 4.4% annually. The New York City MSA improved, rising 0.4% on a quarterly basis and 6.0% annually. In Philadelphia, prices rose 0.3% on a quarterly basis and rose 4.1% annually. After being one of the leading Northeastern MSAs, Rochester, NY saw a quarterly decline of 2.4%, however annual price growth was still solid at 6.2%. This is the second month where Rochester showed negative quarterly growth.
The Midwest was the next-best performer on a quarterly basis, with prices falling 0.2% but rising 4.3% annually. Chicago was the top performer, with prices increasing 0.4% on a quarterly basis and 5.3% on an annual basis. The Rust Belt continued its run with three Ohio MSAs in the top 15: Cincinnati, Columbus, and Dayton.
The South came in third, where prices fell 0.9% on a quarterly basis but rose 0.1% on an annual basis. Virginia Beach was the top performer, with prices up 0.5% on a quarterly basis and up 3.1% annually. Washington DC saw prices fall 0.3% on a quarter-over-quarter (QoQ) basis but increase 1.2% annually. In San Antonio, TX, prices fell 2.4% on a quarterly basis and 2.0% annually. Dallas also got roughed up, falling 2.3% quarterly and 1.9% annually. Florida MSAs like Jacksonville and Orlando also landed in the bottom tier.
The West came in last, where prices fell 0.9% on a quarterly basis and exhibited negative year-over-year (YoY) growth of 0.1% The top Western MSA was Fresno, CA, where prices rose 0.5% quarterly and 1.6% annually. Bakersfield, CA, was also in the top 15, with prices increasing 0.5% quarterly and 0.8% annually. The worst performing MSA was Denver where prices fell 2.1% on a quarterly basis and 2.3% on an annual basis. Seattle also struggled, with prices falling 2.0% on a quarterly basis and 0.9% on an annual basis.
With 2025 in the books, it is time to look forward to 2026. Last year was a year of consolidation for real estate prices. Price growth moderated and the previous darlings of the COVID era gave up gains, while MSAs that underperformed the market after the Great Financial Crisis finally had their day in the sun. Affordability has been such a concern that many places simply became too cheap to ignore.
Will 2026 see a return to normalized home price appreciation? If so, it is hard to see the catalyst. While home prices have cooled off from their torrid 2021-2022 pace, they still are elevated. Affordability is improving the hard way — via wage inflation, which is a much longer process than falling prices or falling rates. Wages are indeed improving, with the latest ADP report showing that job stayers are seeing a 4.4% wage increase while job-changers are getting a 6.6% raise. Wage inflation will have to do the heavy lifting in improving affordability for the foreseeable future.
Can the Fed pitch in? The dot plot from the December FOMC meeting seems to indicate they aren’t going to be much help. The yellow area highlighted below shows the current level of rates, and this implies that we are looking at one or two cuts next year. Fed Funds futures see something similar, although they discount any sort of rate hike (note 3 people think rates should be higher than here) and only see a 5% chance of no cuts.
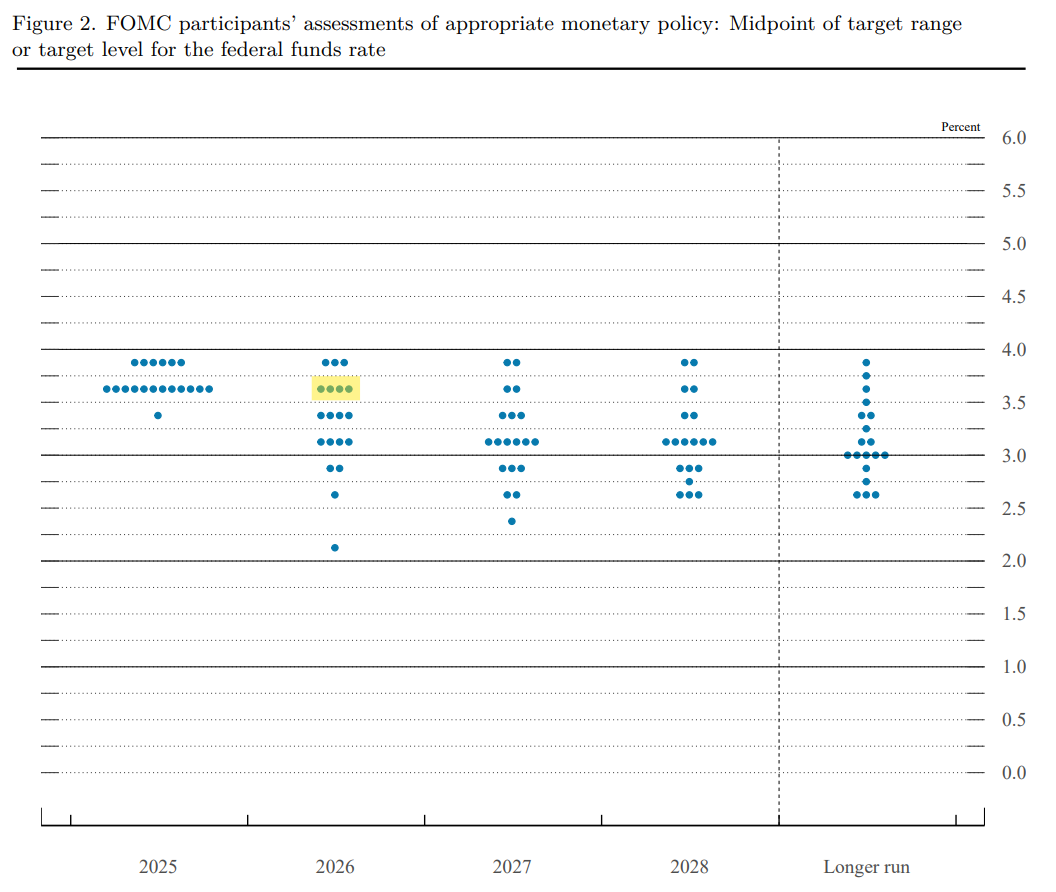
The job market is stable with limited hiring and limited firing. Absent a recession we probably won’t see mass layoffs, and I think most people have spent enough time with ChatGPT to realize it isn’t going to be replacing jobs en masse any time soon. Falling immigration and continued deportation will depress growth in the labor force. The Fed sees the unemployment rate falling slightly in 2026, from 4.6% to 4.5%. They also bumped up their GDP forecast from 1.8% to 2.3%. Bottom line, absent something like a stock market crash or a black swan event, rates will move marginally lower in 2026 but that is it. By the June 2026 meeting, declining shelter inflation will drag the indices close enough to the 2% target that the Fed can cut one more time, declare victory over inflation, and call it a day.
Homebuilding remains depressed, although the NAHB Homebuilder sentiment has improved from its historical lows over the summer. Builders are still cutting prices to move the merchandise, so it is hard to see a catalyst for more building. Tariffs have had a muted effect on input costs, but land acquisition prices remain high, and skilled labor is hard to find. Additional supply via the builders probably isn’t going to move the needle on affordability either.
Politicians are full of largely symbolic ideas, from rent control to limits on institutional investor ownership. These policies won’t help affordability – they will only restrict supply and discourage development. Help isn’t going to come from the government.
The bottom line is that affordability will continue to be driven by rising wage growth against a backdrop of marginal home price appreciation and slightly falling mortgage rates. In that way, 2026 will probably look a lot like 2025 did.
About the Clear Capital Home Data Index (HDI®) Market Report and Forecast
The Clear Capital HDI Market Report and Forecast provides insights into market trends and other leading indices for the real estate market at the national and local levels. A critical difference in the value of Clear Capital’s HDI Market Report and Forecast is the capability to provide more timely and granular reporting than nearly any other home price index provider.
Clear Capital’s HDI Methodology
• Generates the timeliest indices in patent pending, rolling quarter intervals that compare the most recent four months to the previous three months. The rolling quarters have no fixed start date and can be used to generate indices as data flows in, significantly reducing multi-month lag time that may be experienced with other indices.
• Includes both fair market and institutional (real estate owned) transactions, giving equal weight to all market transactions and identifying price tiers at a market specific level. By giving equal weight to all transactions, the HDI is truly representative of each unique market.
• Results from an address-level cascade create an index with the most granular, statistically significant market area available.
• Provides weighted repeat sales and price-per-square-foot index models that use multiple sale types, including single-family homes, multi-family homes and condominiums.
The information contained in this report and forecast is based on sources that are deemed to be reliable; however, no representation or warranty is made as to the accuracy, completeness, or fitness for any particular purpose of any information contained herein. This report is not intended as investment advice, and should not be viewed as any guarantee of value, condition, or other attribute.