

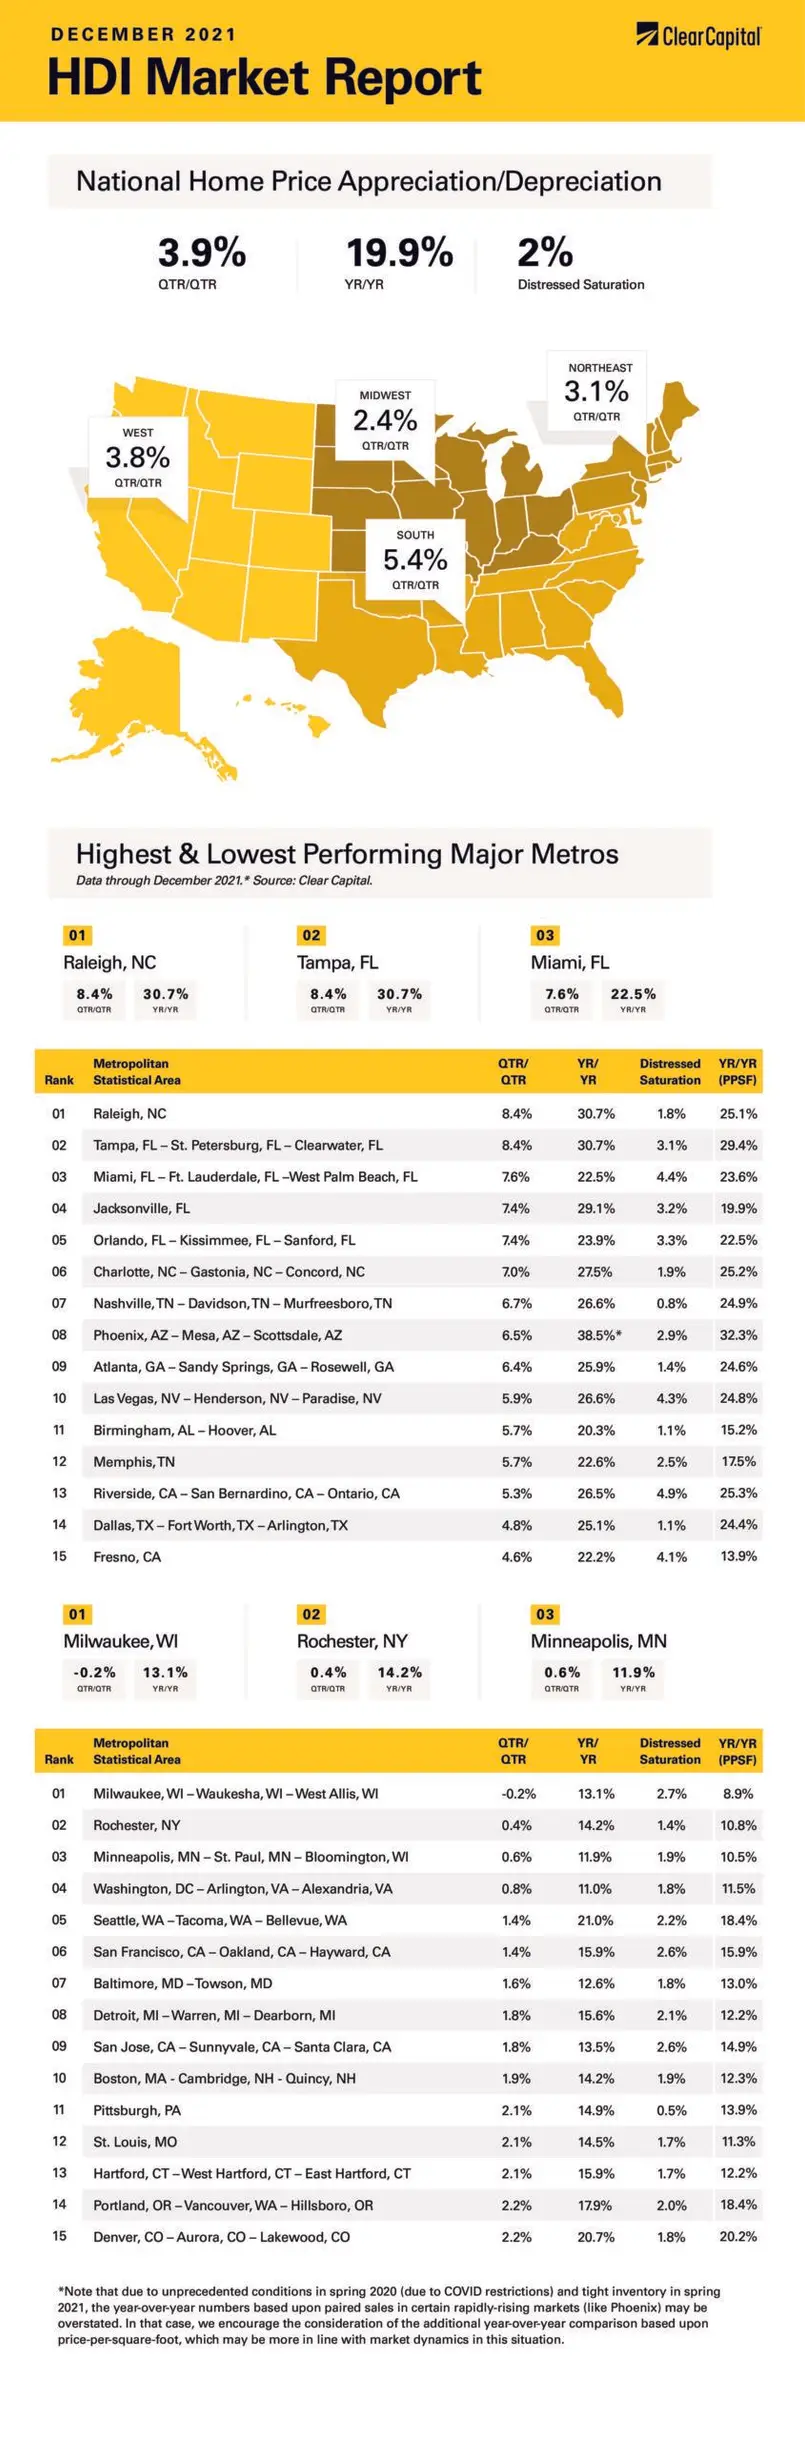
The December 2021 Home Data Index™ (HDI™) Market Report shows national quarter-over-quarter (QoQ) home price growth is at 3.9 percent.
Download the report, or read it below.
* Note that due to unprecedented conditions in spring 2020 (due to COVID restrictions) and tight inventory in spring 2021, the year-over-year numbers based upon paired sales in certain rapidly-rising markets (like Phoenix) may be overstated. In that case, we encourage the consideration of the additional year-over-year comparison based upon price-per-square-foot, which may be more in line with market dynamics in this situation.
Commentary by Brent Nyitray of The Daily Tearsheet
Home price appreciation continued last month as the Clear Capital Home Data Index rose 3.9% quarter-over-quarter (QoQ) and 19.9% on a year-over-year (YoY) basis. This was a slight deceleration from the November pace of 4.4% QoQ and 20.2% YoY. Every region reported home price appreciation, however some of the hottest markets like Phoenix are cooling off slightly. We are also seeing the fastest-growing metropolitan statistical areas (MSAs) concentrated in a few states. Florida took 4 out of the top 5 MSAs in December.
The fastest growing region remains the West, which grew 23% last month. Again, Phoenix was again the leader, with prices rising 39% on a year-over-year basis, compared to 43% last month. On a price-per-square foot basis, prices rose 32%, which is another data point showing this market is still experiencing rapid growth. Las Vegas put in a strong showing, rising 27%.
The South came in second, with a slew of metropolitan statistical areas in the top 10. Raleigh and Tampa tied for first place, where prices rose 31% YoY. Jacksonville, Charlotte, and Nashville all posted strong gains, rising over 25%.
The Northeast came in next, where prices rose 17% on a YoY basis. That said, none of the Northeast MSAs made the top 15.
Finally, the Midwest saw a 16% increase in prices. Since the top 15 MSAs were dominated by the South and West, no Midwestern MSAs made the list. The slowest MSA went to Milwaukee, where prices fell on a quarterly basis, but were still up 13% year-over-year. Minneapolis was also a laggard, with prices rising 12%.
Home prices have been rising so rapidly over the past year that affordability is becoming a concern. This will prove to be an interesting dynamic going forward as affordability is a function of home prices, mortgage rates, and incomes. Rising home prices have been driven by falling interest rates for the past couple of years, and that tailwind is about to turn into a headwind.
If you look at house prices since 2000, the median house price (according to the National Association of Realtors) has risen from $167,500 to $353,900. The median income has risen from $63,292 to $70,762. A general rule of thumb to measure affordability is to divide the median house price by median income and track that ratio over time. That number is currently flashing warning signs. The current ratio is 5x which is higher than it was at the peak of the bubble in 2006. Take this number with a grain of salt, however – the income numbers out of Census are inflation-adjusted, while house prices are not. Still, inflation has been low enough for the past 20 years to not affect the analysis materially. That ratio is the yellow line on the chart below.
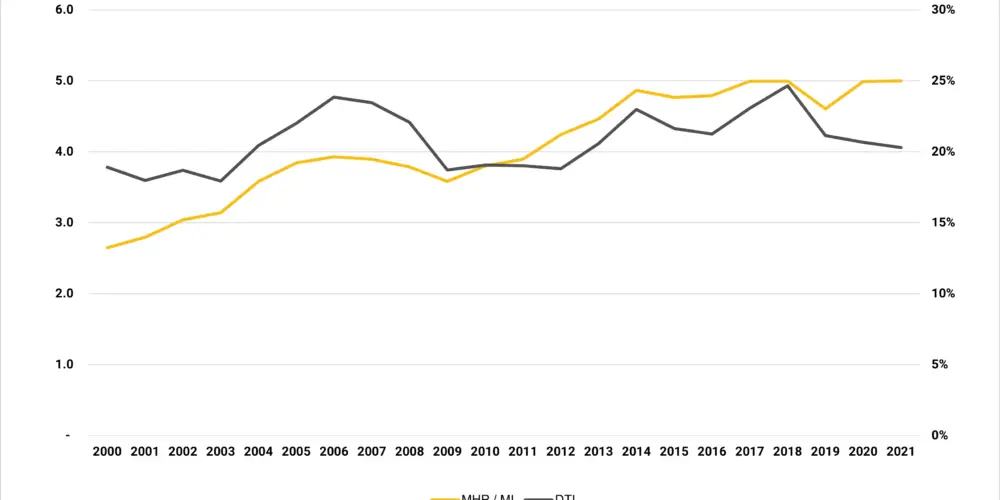
Source: Census Bureau, National Association of Realtors, Freddie Mac
Median house prices and median incomes are only half the story, however. Interest rates matter, too. According to Freddie Mac, the 30-year mortgage cost 8% in 2000. It ended 2021 at just under 3%. As any car dealer will tell you, people focus on the monthly payment and not the sticker price. Monthly payments matter more, which is why they are the gold standard for measuring affordability in mortgage banking.
I took the median house price and calculated the expected mortgage payment, assuming 20% down and the prevailing mortgage rate. I then divided that mortgage payment by median income to come up with a debt-to-income ratio. As you can see from the grey line on the chart, this ratio has remained in a relatively tight range since 2000, oscillating between 18% and 25%. It currently stands at 20%, which is below the historical average of 21%. So, according to this analysis, home prices are still affordable.
So where does this leave us going forward? Home prices are going to be affected primarily by the supply and demand situation which won’t change until we start seeing housing starts well above 2-3 million for several years. Given the sheer amount of professionally managed money entering the single-family rental space, demand will remain strong, while labor and materials constraints will restrict homebuilding.
The consensus amongst mortgage professionals is that mortgage rates are probably headed about 40 to 50 basis points higher in 2022. That will be a negative for affordability, however wages are rising at a 5% clip. The rise in wages will likely offset the increase in mortgage rates. This means we do have the basis for further home price appreciation, however we probably won’t see a repeat of last year, where interest rates and incomes were both working in favor of higher prices. This year, they will work against each other.
About the Clear Capital Home Data Index™ (HDI™) Market Report and Forecast
The Clear Capital HDI Market Report and Forecast provides insights into market trends and other leading indices for the real estate market at the national and local levels. A critical difference in the value of Clear Capital’s HDI Market Report and Forecast is the capability to provide more timely and granular reporting than nearly any other home price index provider.
Clear Capital’s HDI Methodology
• Generates the timeliest indices in patent pending, rolling quarter intervals that compare the most recent four months to the previous three months. The rolling quarters have no fixed start date and can be used to generate indices as data flows in, significantly reducing multi-month lag time that may be experienced with other indices.
• Includes both fair market and institutional (real estate owned) transactions, giving equal weight to all market transactions and identifying price tiers at a market specific level. By giving equal weight to all transactions, the HDI is truly representative of each unique market.
• Results from an address-level cascade create an index with the most granular, statistically significant market area available.
• Provides weighted repeat sales and price-per-square-foot index models that use multiple sale types, including single-family homes, multi-family homes and condominiums.
The information contained in this report and forecast is based on sources that are deemed to be reliable; however, no representation or warranty is made as to the accuracy, completeness, or fitness for any particular purpose of any information contained herein. This report is not intended as investment advice, and should not be viewed as any guarantee of value, condition, or other attribute.