

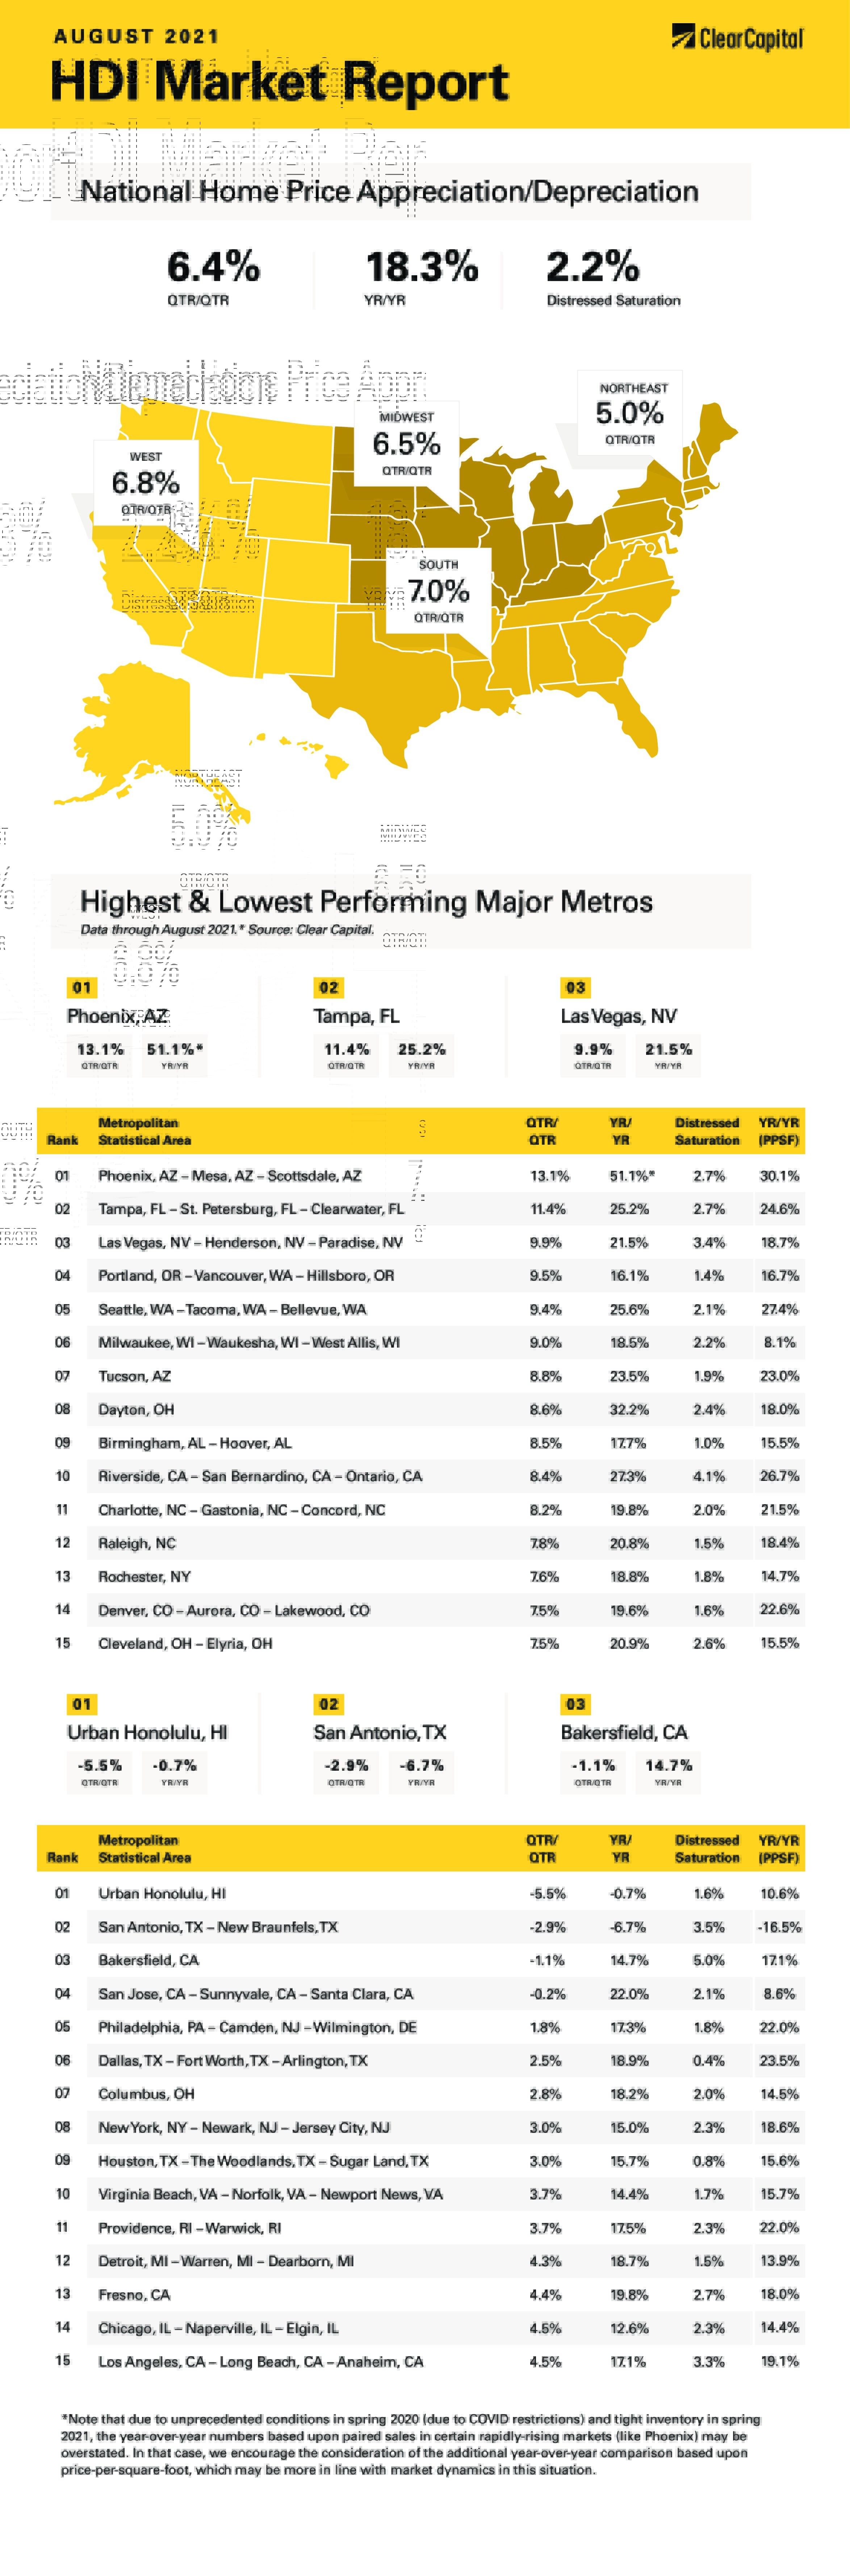
The August 2021 Home Data Index™ (HDI™) Market Report shows national quarter-over-quarter (QoQ) home price growth is at 6.4 percent.
Download the report, or read it below.
* Note that due to unprecedented conditions in spring 2020 (due to COVID restrictions) and tight inventory in spring 2021, the year-over-year numbers based upon paired sales in certain rapidly-rising markets (like Phoenix) may be overstated. In that case, we encourage the consideration of the additional year-over-year comparison based upon price-per-square-foot, which may be more in line with market dynamics in this situation.
Commentary by Brent Nyitray of The Daily Tearsheet
According to the Clear Capital HDI Market Report, home price appreciation continued in August. Nationally, prices rose 18.3% year-over-year (YoY) and 6.4% on a quarter-over-quarter (QoQ) basis. Keep in mind that YoY comparisons can be affected by COVID-related statistical noise, but the overall trend of double-digit home price appreciation is real.
Out West, prices rose 23% overall. Phoenix, Arizona was again a leader, experiencing 51% YoY growth. This was certainly an outlier; however, we saw 30% YoY price appreciation using a price-per-square-foot metric. Other top Western metros include Riverside, California (up 27% YoY), Seattle, Washington (up 26% YoY) and Tucson, Arizona (up 23% YoY).
The Northeast was the next best performer, with prices up 17.6%. The top performer in this region was Rochester, New York, where prices rose 19% YoY.
The Midwest was the worst performer this month, with prices rising a mere 16.6% YoY. The top metro was Dayton, Ohio, where prices rose 32% YoY. Another strong metro was Cleveland, Ohio where prices rose 21% YoY. Columbus, Ohio also saw strong YoY growth at 18.2%.
In the South, prices rose 17.2%. Raleigh, North Carolina saw a 21% YoY increase, while Birmingham, Alabama increased 18% YoY and Charlotte, North Carolina rose 20% YoY.
The lowest performing metros were Honolulu, Hawaii where prices fell to negative 0.7% YoY, and San Antonio, where prices dropped to negative 6.7% YoY. There were a few other metros that saw prices drop on a QoQ basis but were still up double digits YoY.
While the Federal Reserve is probably still at least a year away from raising the federal funds rate, the central bank is beginning to focus on when to reduce its purchases of treasuries and mortgage-backed securities (MBS). In the July FOMC minutes, the Fed gave some color on its thinking, saying, “several participants commented on the benefits that they saw in reducing agency MBS purchases more quickly than treasury securities purchases, noting that the housing sector was exceptionally strong and did not need either actual or perceived support from the Federal Reserve in the form of agency MBS purchases…”
Separately, St. Louis Fed President James Bullard recently warned of an “incipient bubble” in housing prices, which echoes Alan Greenspan’s “irrational exuberance” comment in 1996.
Let’s address the “incipient bubble” first. Bubbles are a rare, psychologically driven phenomenon, which relies on a collective belief amongst buyers, bankers, and regulators that an asset cannot experience a prolonged decline in prices. The memories of 2006 are still too fresh for that to happen, and the fact that almost all post-2008 mortgages are government-guaranteed precludes forced selling since credit losses will be minimal (for the private sector, at least).
The language regarding MBS purchases is another question. While “several participants” does not constitute a majority, the consensus seems to be that the Fed will start trimming asset purchase late this year or early next year. What does this mean for housing prices?
The first question is whether the Federal Reserve’s MBS purchases affect the residential real estate market in the first place. Fortunately, we do have some history to point to — the taper tantrum of 2013. In early 2013, then Fed Chairman Ben Bernanke began to telegraph that the Fed was looking to scale back its extraordinary support for the economy. Treasury yields rose, and MBS spreads widened, which pushed the 30-year mortgage rate from 3.4% to 4.6%. The Fed then announced its first reduction in asset purchases at the December 2013 meeting.
What happened to real estate prices in 2013? They rose about 4.4%, and then rose another 5.2% in 2014, according to the government’s Federal Housing Finance Agency (FHFA) House Price Index, which resembles Clear Capital’s Home Data Index. Note that the Fed was also buying MBS while home prices were falling in the aftermath of the 2006 bubble. Perhaps they would have fallen further without MBS support, but the evidence that their buying affects the housing market is sparse at best.
The Fed may affect prices at the margin, but the supply and demand dynamics of the residential real estate market is the ultimate driver, and that points to higher prices. The National Association of Realtors (NAR) estimate of housing inventory is well below a balanced market, with only 2.6 months worth of supply. Additional supply will depend on new home construction, and housing starts remain stubbornly stuck in the 1.6–1.7 million range — about where they were when census began tracking this data in 1959. The U.S. population has almost doubled since then. The July new home sales data showed a 27% drop, while the median new home price rose 18% to $390,500 as shortages of labor and materials remain a problem for home builders. Home prices may cool off at some point, given that we are probably bumping up affordability constraints, but nothing in the data points to any sort of decline in the near term.
 About the Clear Capital Home Data Index™ (HDI™) Market Report and Forecast
The Clear Capital HDI Market Report and Forecast provides insights into market trends and other leading indices for the real estate market at the national and local levels. A critical difference in the value of Clear Capital’s HDI Market Report and Forecast is the capability to provide more timely and granular reporting than nearly any other home price index provider.
Clear Capital’s HDI Methodology
• Generates the timeliest indices in patent pending, rolling quarter intervals that compare the most recent four months to the previous three months. The rolling quarters have no fixed start date and can be used to generate indices as data flows in, significantly reducing multi-month lag time that may be experienced with other indices.
• Includes both fair market and institutional (real estate owned) transactions, giving equal weight to all market transactions and identifying price tiers at a market specific level. By giving equal weight to all transactions, the HDI is truly representative of each unique market.
• Results from an address-level cascade create an index with the most granular, statistically significant market area available.
• Provides weighted repeat sales and price-per-square-foot index models that use multiple sale types, including single-family homes, multi-family homes and condominiums.
The information contained in this report and forecast is based on sources that are deemed to be reliable; however, no representation or warranty is made as to the accuracy, completeness, or fitness for any particular purpose of any information contained herein. This report is not intended as investment advice, and should not be viewed as any guarantee of value, condition, or other attribute.