

The April 2025 Clear Capital Home Data Index (HDI®) Market Report shows national quarter-over-quarter home price growth is at 0.8 percent.
Download the report, or read it below.
Commentary by Brent Nyitray of The Daily Tearsheet
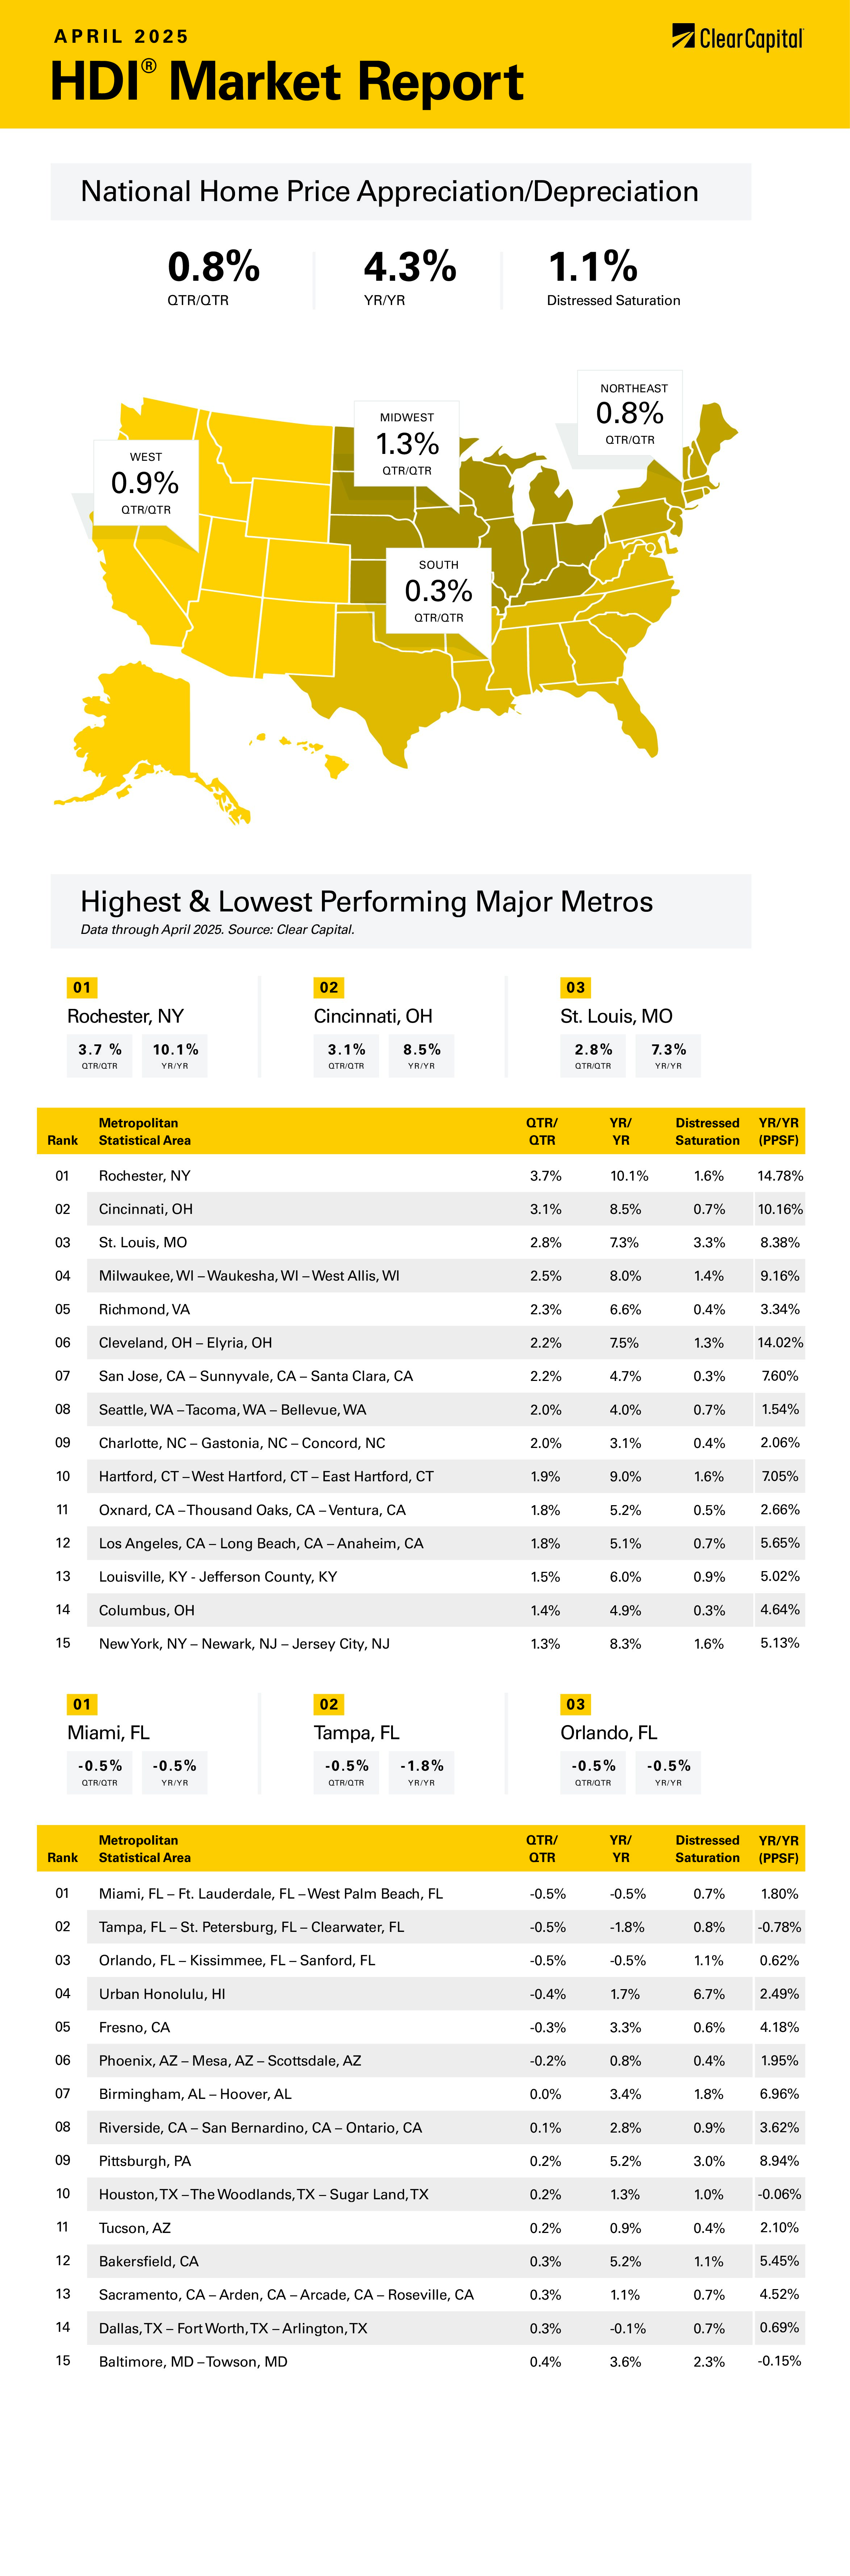
Home prices rose 0.8% quarter-over-quarter (QoQ) in April, according to the Clear Capital Home Data Index. On a year-over-year (YoY) basis, prices rose 4.3%. All regions rose on a YoY basis and a QoQ basis.
The northeast performed the best on a YoY basis, increasing 0.8% QoQ and 7.0% YoY. The top northeastern MSA was Rochester, NY where prices rose 3.7% QoQ and 10.1% YoY. Hartford, CT rose 1.9% QoQ and 9% YoY, and the New York City metropolitan area rose 1.3% QoQ and 8.3% YoY.
The midwest was the next best performing region on a year-over-year basis, where prices rose 1.3% QoQ and 6.2% YoY. Cincinnati, OH was the top Midwestern MSA where prices rose 3.1% QoQ and 8.5% YoY. Milwaukee was next at 2.5% QoQ and 8.0% YoY. St. Louis, MO was also a standout with prices rising 2.8% QoQ and 7.3% YoY.
The west was the third-best performing region, where prices rose 0.9% QoQ and 3.2% YoY. The best performing MSA was San Jose, CA where prices rose 2.2% QoQ and 4.7% YoY. The Los Angeles metro was the next-best performer where prices rose 1.8% QoQ and 5.1% YoY. Seattle also performed strongly, with prices rising 2% QoQ and 4% YoY. The worst western MSA was Fresno, CA where prices fell 0.3% QoQ and increased 3.3% YoY.
The south was the worst-performing MSA, with prices rising 0.3% QoQ and 2.3% YoY. Richmond, VA was the top performer in the south, where prices rose 2.3% QoQ and 6.6% YoY. Charlotte, NC was the next-best area, where prices rose 2.0% QoQ and 3.1% YoY. The worst-performing MSA was Tampa, FL where prices fell 0.5% QoQ and 1.8% YoY. Miami also struggled, where prices fell 0.5% QoQ and 0.5% YoY.
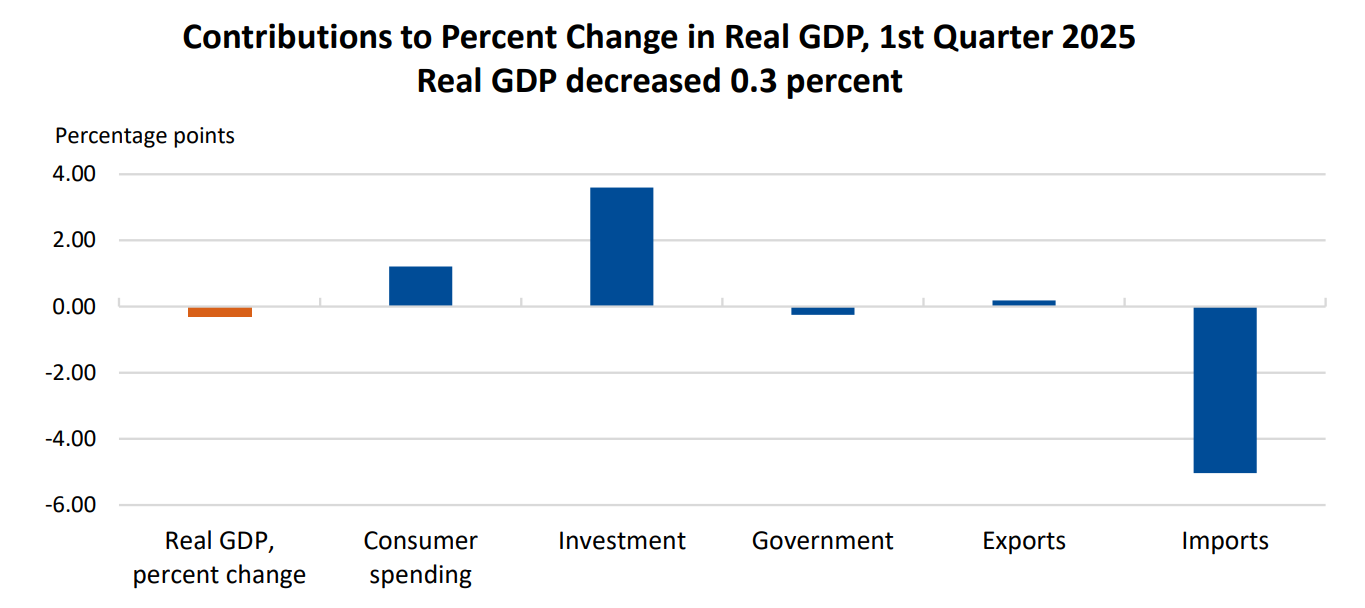
The economy contracted in the first quarter of 2025, which was driven primarily by an increase in imports as businesses front-loaded purchases to get ahead of any potential tariffs. This was offset by a jump in investments, which was driven by businesses building inventory in response to potential tariffs. The increase in investments pushed up GDP growth by about 3.6%, while the increase in tariffs pulled down GDP growth by about 5%. Government spending was mildly negative, while consumption added about 1.2% to GDP. If you strip out the tariff noise, final sales to domestic purchasers rose 3%, which is a pretty decent number, and is an increase from Q4.
The tariff announcements came in April, so the reaction in the stock market (and the corresponding decline in consumer sentiment) will be reflected in the second quarter GDP report. If the negative effects of tariffs continue into May and June, we could be looking at a recession, at least under the classic definition of two quarters of negative GDP growth. The current Atlanta Fed GDPNow estimate has 1.1% growth for Q2, however the decreases in consumer sentiment should have a negative effect on consumption. Any major slowdown in growth should push the Fed to start cutting rates to get monetary policy to neutrality, which is where policy is neither stimulative nor restrictive. Currently, the Fed is still in tightening mode, which works to slow down the economy. Neutrality (known as r* or r-star) is in the low 3% range. To stimulate the economy, the Fed Funds rate would probably need to fall below 3%. Absent the tariff business, the Fed would probably be cutting rates already. There certainly is a better economic argument to cut rates now than when the Fed first started cutting in late 2024.
The Fed Funds futures are currently predicting that the Fed will do nothing at the May meeting and have a 63% probability that the Fed will leave rates alone at the June meeting. This is a substantial change — up until the stronger-than-expected jobs report for April, the futures were pricing in a 60% chance of a cut in June. A month ago, it was treated as a near-certainty. The December futures go back and forth between three and four cuts this year, which would put the Fed Funds rate at or just above r-star by the end of the year.
What does this economic backdrop mean for housing? Mortgage and real estate professionals went into 2025 thinking that rates would be coming down and that would support a strong spring selling season. So far, that hasn’t really materialized, with existing home sales down 2% on a year-over-year basis to a depressed annual rate of only 4 million units.
Home prices will continue to be constrained by affordability issues, as mortgage rates will probably stay above 6% throughout the year, unless the Fed more aggressively cuts rates.
Tariffs seem to have a negligible impact on new home construction, with homebuilder Pulte estimating that tariffs would have about a 1% negative impact on the cost of a new home. Since Pulte’s average selling price is just over $500,000, a 1% hit is about $5,000. Since the builders don’t seem to have much pricing power these days, they won’t be able to pass on these costs to buyers. They will probably simply absorb these incremental costs and report narrower gross margins. The bottom line is that tariffs probably won’t cause a significant increase in housing inflation.
If the tariffs end up being smaller than feared and inflation doesn’t re-ignite, the Fed will probably have the leeway to lower the Fed Funds rate to 3%. This may cause mortgage rates to drop below 6% into the mid 5% range. This would go a long way towards improving the affordability provided that home price appreciation doesn’t accelerate. The economic backdrop doesn’t really support above-average home price appreciation, and the supply situation should prevent any meaningful drop in home prices outside of a few MSAs.
About the Clear Capital Home Data Index (HDI®) Market Report and Forecast
The Clear Capital HDI Market Report and Forecast provides insights into market trends and other leading indices for the real estate market at the national and local levels. A critical difference in the value of Clear Capital’s HDI Market Report and Forecast is the capability to provide more timely and granular reporting than nearly any other home price index provider.
Clear Capital’s HDI Methodology
• Generates the timeliest indices in patent pending, rolling quarter intervals that compare the most recent four months to the previous three months. The rolling quarters have no fixed start date and can be used to generate indices as data flows in, significantly reducing multi-month lag time that may be experienced with other indices.
• Includes both fair market and institutional (real estate owned) transactions, giving equal weight to all market transactions and identifying price tiers at a market specific level. By giving equal weight to all transactions, the HDI is truly representative of each unique market.
• Results from an address-level cascade create an index with the most granular, statistically significant market area available.
• Provides weighted repeat sales and price-per-square-foot index models that use multiple sale types, including single-family homes, multi-family homes and condominiums.
The information contained in this report and forecast is based on sources that are deemed to be reliable; however, no representation or warranty is made as to the accuracy, completeness, or fitness for any particular purpose of any information contained herein. This report is not intended as investment advice, and should not be viewed as any guarantee of value, condition, or other attribute.