
West Maintains Highest Regional Growth
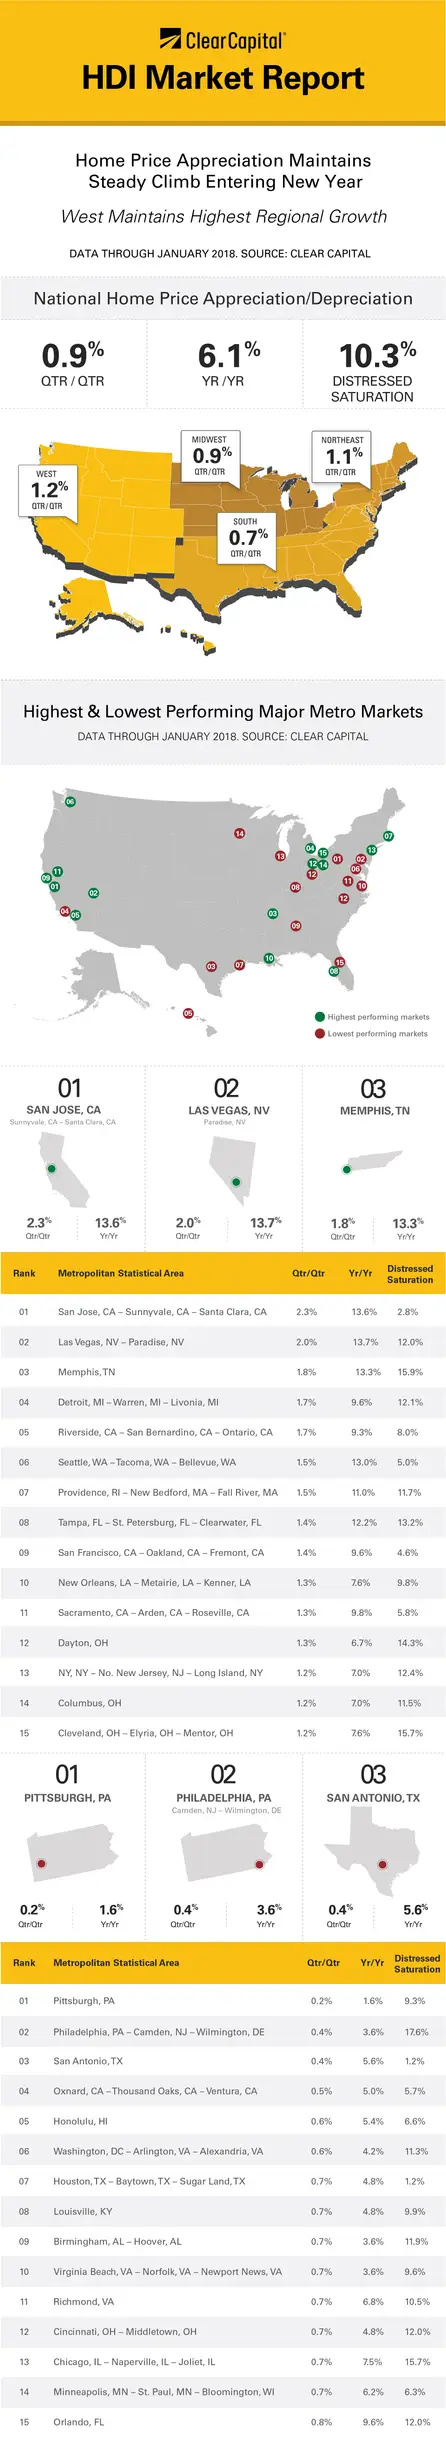
Today, Clear Capital released its monthly Home Data Index™ (HDI™) report showing national, quarter-over-quarter (QOQ) home price appreciation maintained steady growth of 0.9 percent with national distressed saturation continuing to fall 10.3 percent from 10.6 percent the previous month, December 2017.
Regional performance across the West, Northeast, South and Midwest revealed the following:
Western Region
For January, the West continued to maintain the highest regional growth in the nation with 1.2 percent QOQ growth rate. However, there have been signs that the West is faltering as it no longer holds a majority of the top 15 fastest growing metros with only six metros making the list.
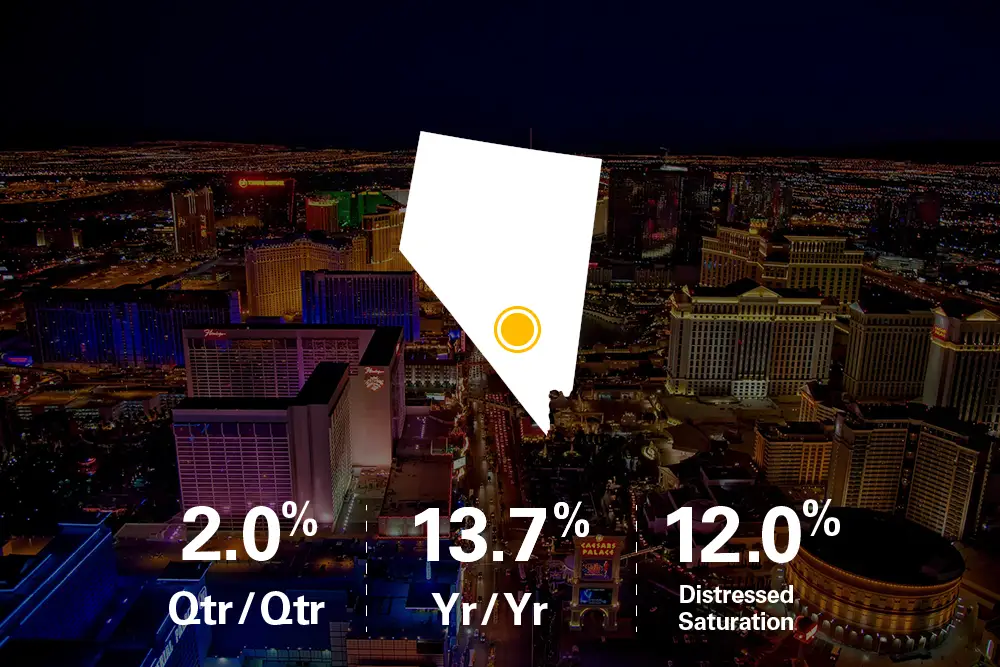
San Jose, California and Las Vegas, Nevada continue to lead the region and the nation with strong QOQ growth at 2.28 percent and 2.01percent, respectively.
Rounding out the six western metros in the top 15 is Seattle, Washington, however, it was one of the few areas that appears to be slipping maintaining high growth during the summer months. Additionally, Seattle’s QOQ growth declined 0.31 percent to 1.51 percent.
Notable mentions in the Western region included:
- Honolulu, Hawaii with marginal improvements for the winter showing marginal QOQ growth of 0.30 percent to reach 0.61percent overall.
- Oxnard, California had a dismal performance with 0.47 percent QOQ growth, down 0.12 percent from December.
Northeast Region
The Northeast saw a sharp jump in QOQ home price appreciation rivaling the Western region with 1.1 percent growth, up 0.3 percent from December. Other standout performers include:
- Providence, Rhode Island as one of the Northeast’s consistent top performers showing a decline in QOQ growth by 0.13 percent to 1.51 percent for the month of January.
- New York, New York climb back into the top 15 with QOQ growth of 1.24 percent, up marginally from December.
- Philadelphia and Pittsburgh, Pennsylvania comprised the bottom 15 with 0.43 percent and 0.16 percent QOQ growth, respectively.
- Rochester, New York reflected the largest increase in QOQ growth up from 0.71 percent in December to 1.07 percent.
South Region
The South experienced a drop in growth from December, down 0.2 percent to 0.7 percent QOQ growth for January. Additional movement in the South was seen with:
- Memphis, Tennessee continuing as South’s top performer with 1.75 percent QOQ growth.
- Tampa, Florida and New Orleans, Louisiana reserved spots in the top 15 with QOQ growth at 1.38 percent and 1.29 percent, respectively.
- Orlando, Florida and Houston, Texas had the largest drops in QOQ growth in the South and across the nation, although they were not the worst performers. Orlando beat out the following in QOQ growth:
- Richmond, Virginia with 0.71 percent
- Virginia Beach, Virginia with 0.70 percent
- Birmingham, Alabama with 0.69 percent
Midwest Region
The Midwest had moderate gains, up 0.2 percent from December, to 0.9 percent QOQ growth for the month of January. Detroit, Michigan continues to experience solid growth with QOQ growth rate of 1.72 percent. Several other Midwest MSAs also saw momentum this month:
- Dayton, Ohio – 1.28 percent; 0.55 percent growth
- Columbus, Ohio – 1.24 percent; 0.11 percent growth
- Cleveland, Ohio – 1.24 percent; 0.26 percent growth
The Midwest’s lesser performers in the bottom 15 with QOQ growth were:
- Louisville, Kentucky – 0.67 percent
- Minneapolis, Minnesota – 0.75 percent
- Chicago, Illinois – 0.75 percent
- Cincinnati, Ohio – 0.72 percent
The Clear Capital January HDI report features the top 15 appreciating and depreciating MSAs based on quarter-over-quarter and year-over-year data, as well as national performance based on four separate regions: West, Midwest, South and Northeast.
About the Clear Capital® Home Data Index (HDI) Market Report
The Clear Capital HDI Market Report provides insights into market trends and other leading indices for the real estate market at the national and local levels. A critical difference in the value of the HDI Market Report is the capability of Clear Capital to provide more timely and granular reporting than nearly any other home price index provider.
Clear Capital® HDI Methodology
- Generates the timeliest indices in patent pending rolling quarter intervals that compare the most recent four months to the previous three months. The rolling quarters have no fixed start date and can be used to generate indices as data flows in, significantly reducing the multi-month lag time experienced with other indices.
- Includes both fair market and institutional (real estate owned) transactions, giving equal weight to all market transactions and identifying price tiers at a market specific level. By giving equal weight to all transactions, the HDI is truly representative of each unique market.
- Results from an address-level cascade create an index with the most granular, statistically significant market area available.
- Provides weighted repeat sales and price-per-square-foot index models that use multiple sale types, including single-family homes, multi-family homes, and condominiums.
The information contained in this report is based on sources that are deemed to be reliable; however no representation or warranty is made as to the accuracy, completeness, or fitness for any particular purpose of any information contained herein. This report is not intended as investment advice, and should not be viewed as any guarantee of value, condition, or other attribute.