

The December 2022 Home Data Index™ (HDI™) Market Report shows national quarter-over-quarter (QoQ) home price growth is at -3.2 percent.
Download the report, or read it below.
Commentary by Brent Nyitray of The Daily Tearsheet
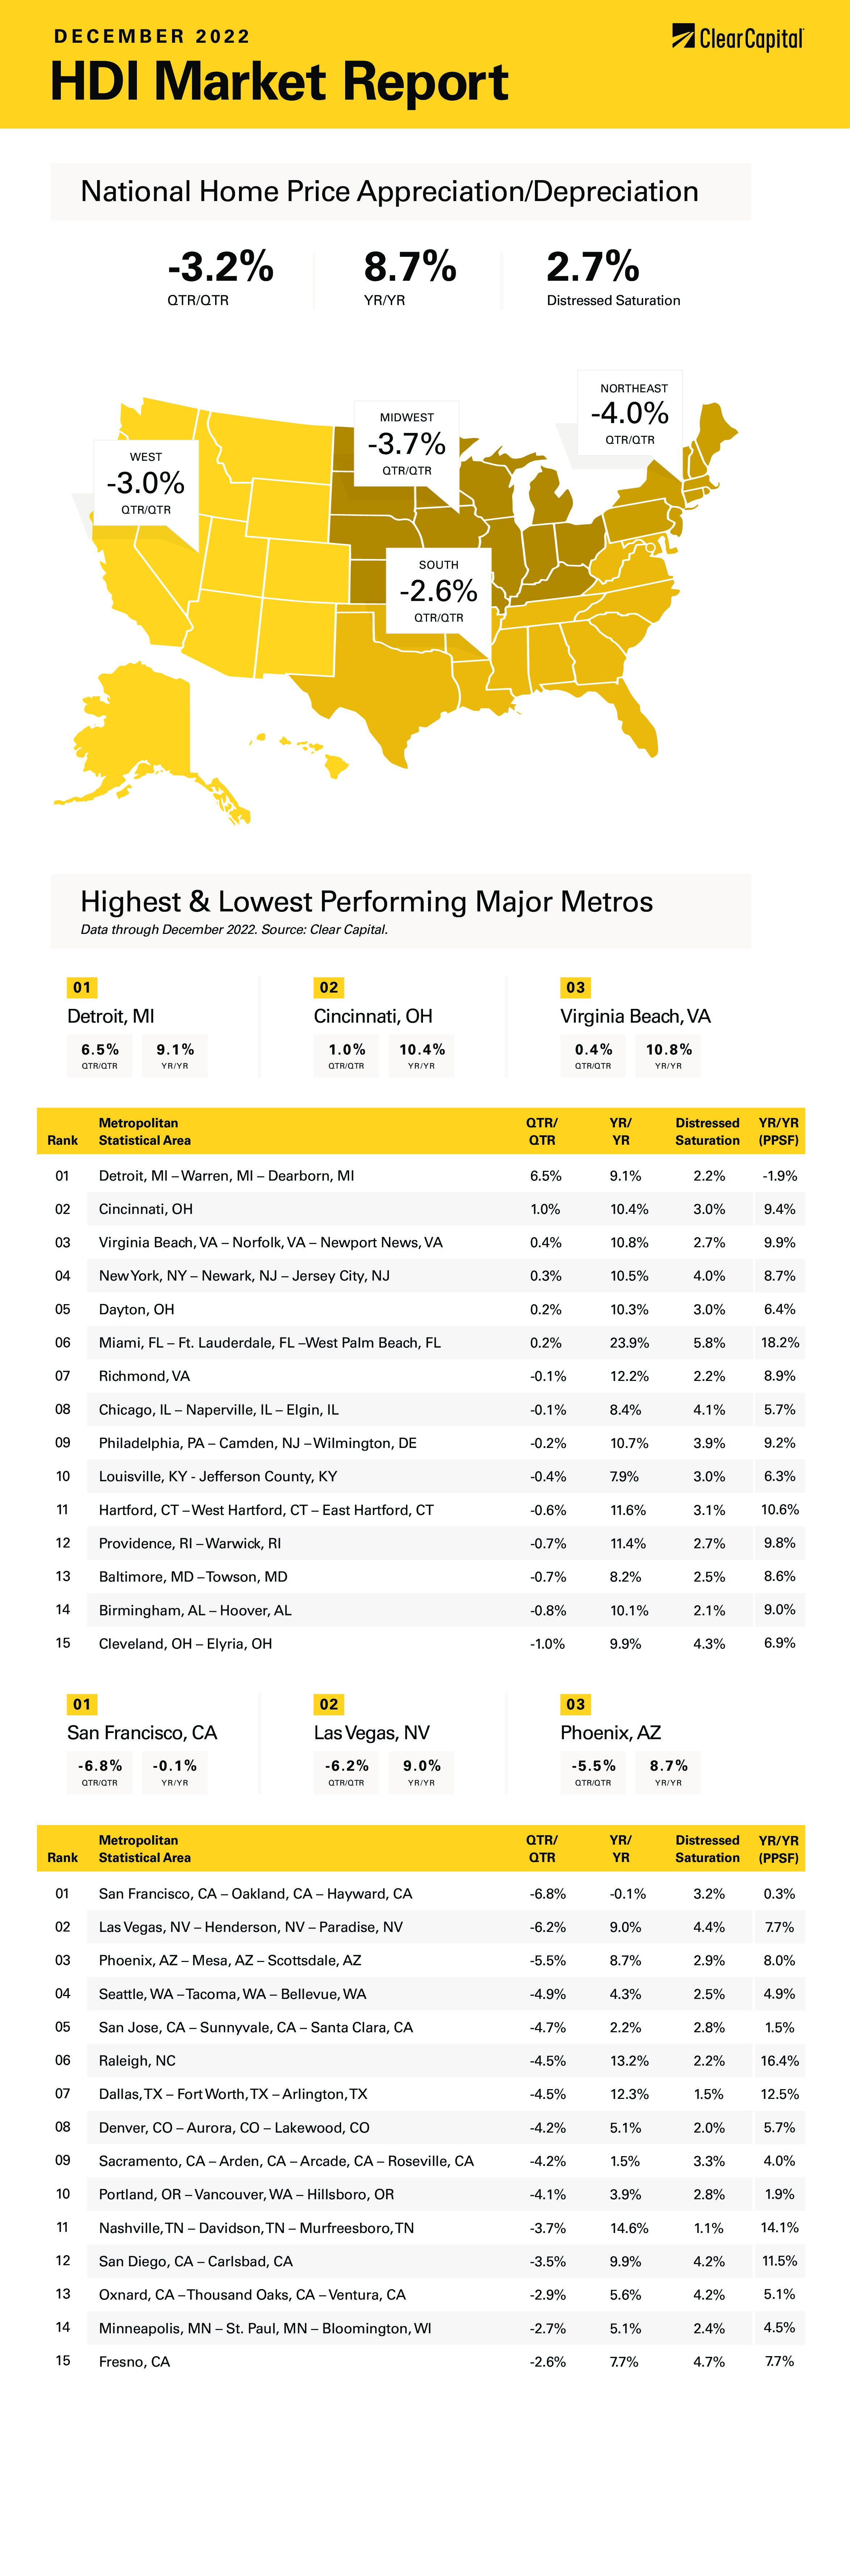
Home price appreciation decelerated again in December as the Clear Capital Home Data Index fell 3.2% quarter-over-quarter (QoQ) and rose 8.7% on a year-over-year (YoY) basis. This compares to a 2.4% QoQ decrease and a 10.3% YoY increase in November. Every region reported declines.
The South performed the best, where prices fell 2.6% QoQ, however it rose 11.4% YoY. Miami was the top performer with prices modestly positive on a QoQ basis and up 23.9% YoY. Virginia Beach rose 0.4% QoQ and 10.8% YoY.
The West came in second with prices falling 3.0% QoQ. Prices still rose 6.9% on a YoY basis. San Francisco experienced the biggest quarterly decline, falling 6.8% QoQ and 0.1% YoY. Las Vegas was down 6.2% QoQ and Phoenix was down 5.5%. I suspect we will see YoY declines creep into most of these markets given their stratospheric rise over the past two years.
The Midwest came in next, falling 3.7% QoQ and rising 6.9% YoY. The leading MSA was Detroit, which rose 6.5% QoQ and 9.1% YoY. Cincinnati rose 10.4% YoY and Chicago was up 8.4%.
The Northeast came in last, falling 4.0% on a quarterly basis. Annual growth came in at 9.3%, with New York City area – up 10.5% – leading the way.
The December Federal Open Market Committee (FOMC) meeting was a disappointment for investors hoping for a pivot in Fed policy. Despite positive surprises on the inflation front, the FOMC bumped up its forecast for the end-of-2023 Fed Funds rate from 4.6% to 5.1%. They also changed their estimate for the core personal consumption expenditure (PCE) inflation rate to 3.5% from 3.1%.
Here is where it gets interesting. Take a look at the chart below, which is the market’s forecast for the Fed Funds rate at the end of 2023 based on where the Fed Funds futures are trading. The x-axis is the Fed Funds target, and the y-axis is the probability it happens based on where the Fed Funds futures are trading in the market. I have notated where the current Fed Funds rate is, where the market thinks it will be, and where the FOMC thinks it will be. The source for this chart is the Chicago Mercantile Exchange.
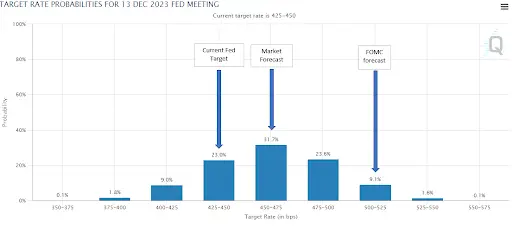
The current Fed Funds rate is 4.25% – 4.5%. The market sees another 25 basis points in tightening next year and that is it. In fact, it assigns a mere 9% probability that the Fed’s forecast is accurate. That said, this isn’t the only market-based contradiction out there. The 1-year Treasury Inflation-Protected Securities (TIPS) has a breakeven inflation rate for next year of 2.3%. These securities are like treasuries except that they compensate the investor for inflation. The breakeven rate can be thought of as the market’s forecast for inflation. This isn’t a perfect apples-to-apples comparison because the TIPS are based on a different inflation index, however it is interesting that the market sees a materially lower inflation rate than the Fed. The Fed sees the headline PCE inflation index at 3.1% next year. The market thinks headline Consumer Price Index (CPI) inflation will be 2.3%. The indices are different, but not that much different. This is another big market contradiction of the Fed’s forecast.
Finally, we have an inverted yield curve, where the yield on the 10-year treasury is below the short-term interest rate. The 10-year treasury is yielding about 50 basis points lower than the current Fed Funds rate. What does all of this tell us? This is a harbinger of rate cuts ahead. Bottom line: The market isn’t buying the Fed’s narrative. At all. It also tells us that the market sees a meaningful chance of a recession next year. I suspect if the Fed does what it says it will do, we will see a recession. In fact, given that monetary policy hits the economy with a lag, one is probably baked into the cake already.
What does this mean for real estate assets? Lower mortgage rates. As the economy weakens, investors will pile into treasuries and mortgage-backed securities. The mortgage-backed securities are key because these are the biggest input into mortgage rates. These bonds carry the same credit risk of treasuries (i.e., none) and are trading cheaply relative to treasuries. This represents a potential drop in mortgage rates even if the 10-year doesn’t move. This is one leg in the affordability issue for housing.
The second leg is falling home prices, which look set to continue, especially in the overheated markets from the COVID-19 pandemic. The current real estate indices reflect negotiations that took place over the summer when rates were lower. We should see real estate prices continue to fall given the natural seasonality and the interest rate effect. Affordability should improve materially as we head into the spring selling season, which is about a month away. Finally, wages continue to grow, which probably goes the farthest in fixing the affordability issue. The affordability issue is the key to bringing back the first-time homebuyer, which will bring back home sales. 2023 won’t be as good as 2021 for the real estate industry, but it won’t be as bad as 2022, either.
About the Clear Capital Home Data Index™ (HDI™) Market Report and Forecast
The Clear Capital HDI Market Report and Forecast provides insights into market trends and other leading indices for the real estate market at the national and local levels. A critical difference in the value of Clear Capital’s HDI Market Report and Forecast is the capability to provide more timely and granular reporting than nearly any other home price index provider.
Clear Capital’s HDI Methodology
• Generates the timeliest indices in patent pending, rolling quarter intervals that compare the most recent four months to the previous three months. The rolling quarters have no fixed start date and can be used to generate indices as data flows in, significantly reducing multi-month lag time that may be experienced with other indices.
• Includes both fair market and institutional (real estate owned) transactions, giving equal weight to all market transactions and identifying price tiers at a market specific level. By giving equal weight to all transactions, the HDI is truly representative of each unique market.
• Results from an address-level cascade create an index with the most granular, statistically significant market area available.
• Provides weighted repeat sales and price-per-square-foot index models that use multiple sale types, including single-family homes, multi-family homes and condominiums.
The information contained in this report and forecast is based on sources that are deemed to be reliable; however, no representation or warranty is made as to the accuracy, completeness, or fitness for any particular purpose of any information contained herein. This report is not intended as investment advice, and should not be viewed as any guarantee of value, condition, or other attribute.