

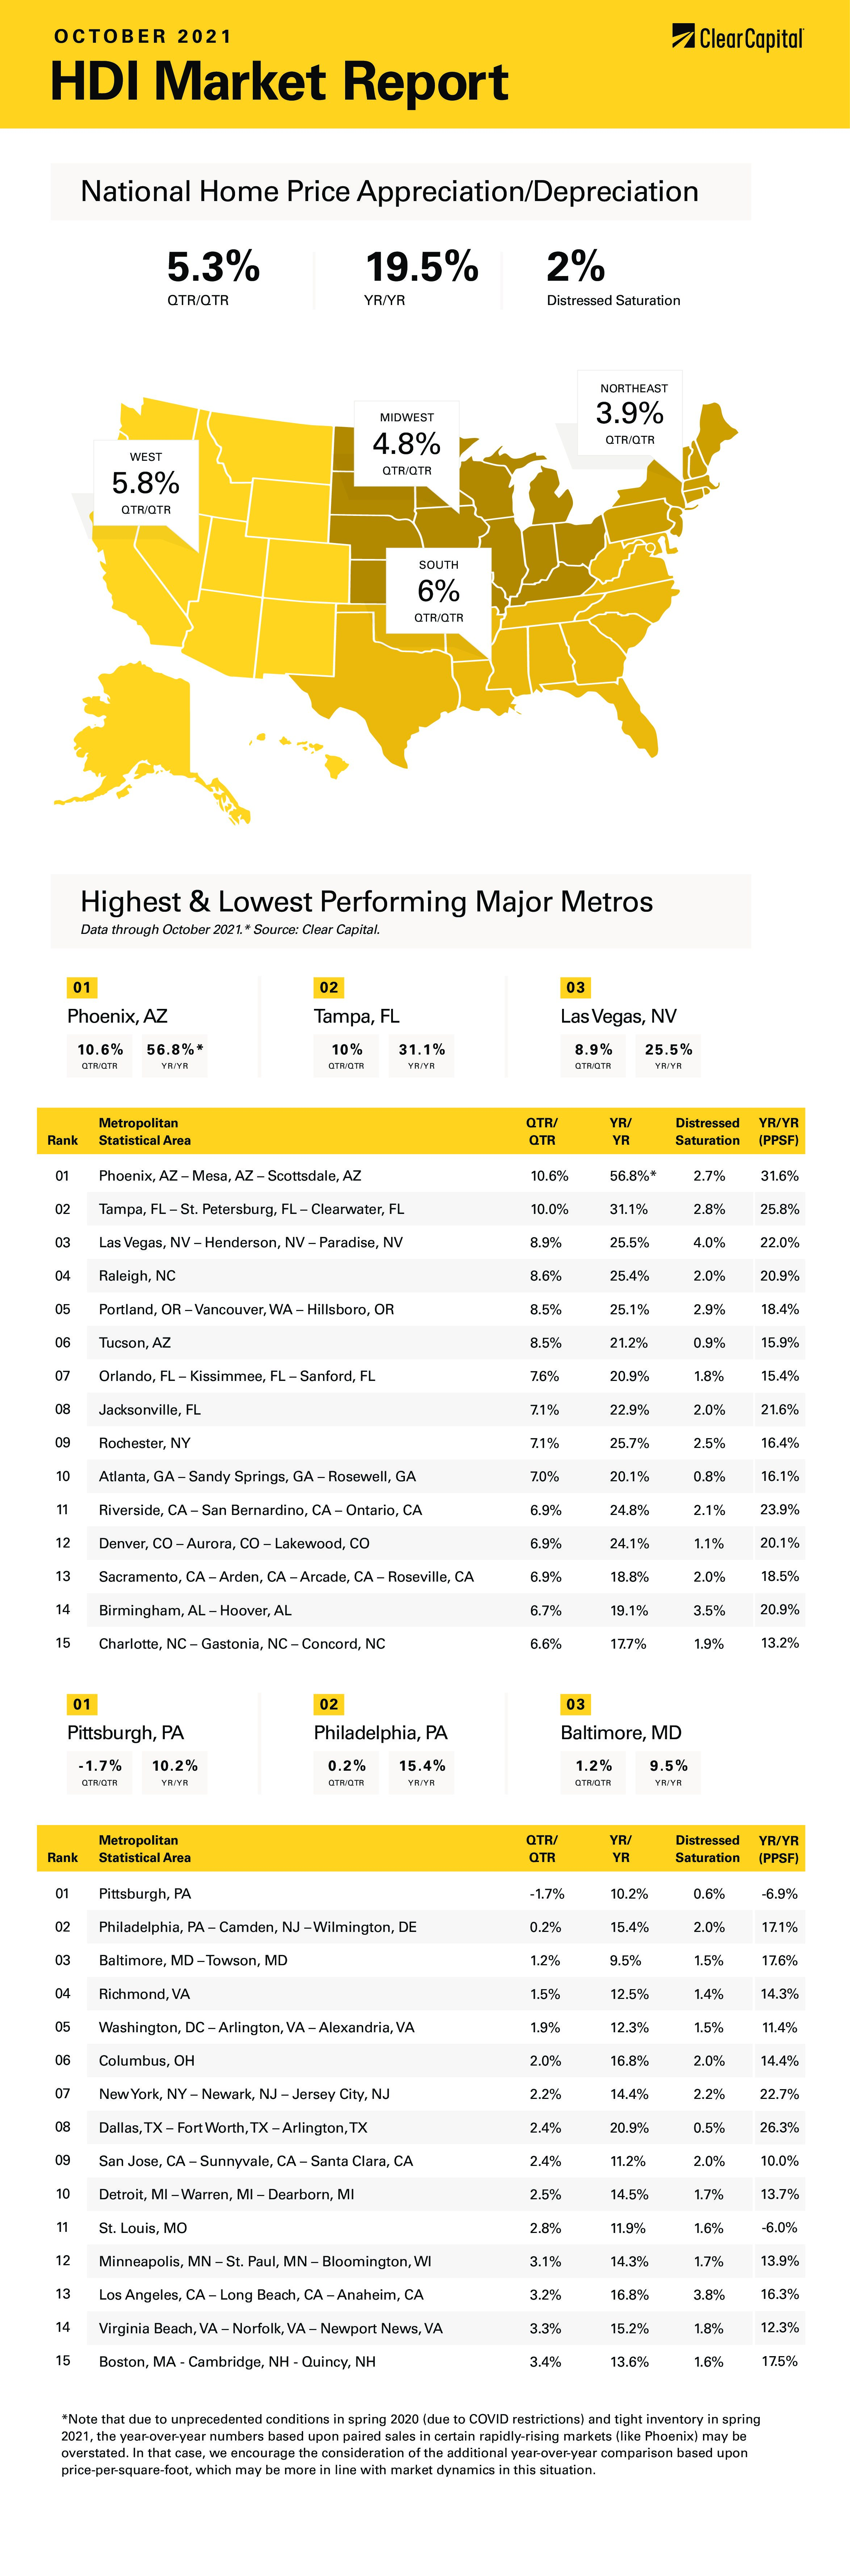
The October 2021 Home Data Index™ (HDI™) Market Report shows national quarter-over-quarter (QoQ) home price growth is at 5.3 percent.
Download the report, or read it below.
* Note that due to unprecedented conditions in spring 2020 (due to COVID restrictions) and tight inventory in spring 2021, the year-over-year numbers based upon paired sales in certain rapidly-rising markets (like Phoenix) may be overstated. In that case, we encourage the consideration of the additional year-over-year comparison based upon price-per-square-foot, which may be more in line with market dynamics in this situation.
Commentary by Brent Nyitray of The Daily Tearsheet
Home price appreciation accelerated in October, according to the Clear Capital Home Data Index report. Prices rose 5.3% on a quarter-over-quarter (QoQ) basis and rose nearly 20% on a year-over-year (YoY) basis.
The west was again the leader, with prices increasing 24.3% on a YoY basis. The strongest metropolitan statistical area (MSA) in the west was again Phoenix, where prices rose 57%. While some COVID-related noise might be exaggerating the numbers there, strong appreciation there was confirmed by a 31% increase in price-per-square-foot. Other strong western MSAs include Las Vegas (up 26%) and Portland (up 21%).
The south was the next best performer, with prices rising 20.5% YoY. Tampa was the leader here, with prices rising 31%. Other top southern MSAs included Raleigh (up 25%) and Orlando (up 25%).
The northeast saw prices rise 16.7%. The top performer here was Providence, where prices rose 19%. We also saw prices rise 18% in Hartford.
Finally, prices in the midwest rose 15.9%. The top performers here was Columbus, where prices rose 17%.
We didn’t see any MSAs with negative year-over-year numbers, however Pittsburgh was down on a quarter-over-quarter basis. Philly was up marginally on a QoQ basis as well.
While the residential real estate market has been experiencing torrid growth, the economy seems to be slowing down. The advance estimate for third quarter GDP came in at a disappointing 2% and the Chicago Fed National Activity Index turned negative in September, indicating the economy is growing below trend. The conventional wisdom was that the economy would accelerate into the end of the year; instead, the economy seems to be decelerating.
The pandemic certainly explains part of what is going on. However, the ubiquitous shortages are having an effect as well. Shortages of lumber, construction materials and skilled labor is keeping housing starts at 1959 levels. This is pushing up house prices as demand is insatiable.
The Great Resignation remains a mystery to most policy makers, and regardless of the reason for it, wages are probably going to increase. This sets the stage for the wage-price spiral, which is something we haven’t seen for a long time.
Economically, we seem to be heading for a replay of the 1970s, where sluggish growth and inflation were the primary economic trends. The parallels are there: a huge jump in government spending (Build Back Better versus LBJ’s “guns and butter” policies) and supply shocks (COVID-related shortages versus the OPEC supply shocks). In the 1970s, this set of affairs was referred to as stagflation (a mixture of stagnation and inflation). If this is the case, then investors should take a hard look at their portfolios.
Housing has always been an excellent inflation hedge. In the first quarter of 1970, the median home price was $23,900. By the first quarter of 1980, the median price was $63,700. If you annualize this growth, it works out to be 10.3%. This did beat inflation, as the Consumer Price Index rose at a 7.4% annual pace. In comparison, the S&P 500 grew about 2% per year during the 1970s. Treasuries performed so poorly during that period they earned the moniker “certificates of confiscation.”
Note that the median home price measures something different than the Clear Capital Home Data index, which looks at matched sales. The Clear Capital Index looks at the same home, so it is a much more granular look at home price appreciation. The median home price has some noise in it; however real estate was one of the best-performing assets during the 1970s, along with commodities and gold.
Institutions seem to be gravitating towards single family rentals, which makes sense. Single family rentals have cap rates (in other words income) in the mid-to-high single digits and if you tack on mid-teens home price appreciation, you get a fantastic return on investment. Aside from the common names like American Homes 4 Rent and Invitation Homes, private equity firms are raising capital for this strategy. Given the housing shortage (NAR estimates it is over 5 million), we should see strong price appreciation going forward.
 About the Clear Capital Home Data Index™ (HDI™) Market Report and Forecast
The Clear Capital HDI Market Report and Forecast provides insights into market trends and other leading indices for the real estate market at the national and local levels. A critical difference in the value of Clear Capital’s HDI Market Report and Forecast is the capability to provide more timely and granular reporting than nearly any other home price index provider.
Clear Capital’s HDI Methodology
• Generates the timeliest indices in patent pending, rolling quarter intervals that compare the most recent four months to the previous three months. The rolling quarters have no fixed start date and can be used to generate indices as data flows in, significantly reducing multi-month lag time that may be experienced with other indices.
• Includes both fair market and institutional (real estate owned) transactions, giving equal weight to all market transactions and identifying price tiers at a market specific level. By giving equal weight to all transactions, the HDI is truly representative of each unique market.
• Results from an address-level cascade create an index with the most granular, statistically significant market area available.
• Provides weighted repeat sales and price-per-square-foot index models that use multiple sale types, including single-family homes, multi-family homes and condominiums.
The information contained in this report and forecast is based on sources that are deemed to be reliable; however, no representation or warranty is made as to the accuracy, completeness, or fitness for any particular purpose of any information contained herein. This report is not intended as investment advice, and should not be viewed as any guarantee of value, condition, or other attribute.