

Buyers and Renters to Compete for Supply
Clear Capital released its monthly Home Data Index™ (HDI™) report, showing consistent quarter-over-quarter home price growth for the West, but with a decrease in quarter-over-quarter home price appreciation for Las Vegas and Seattle.
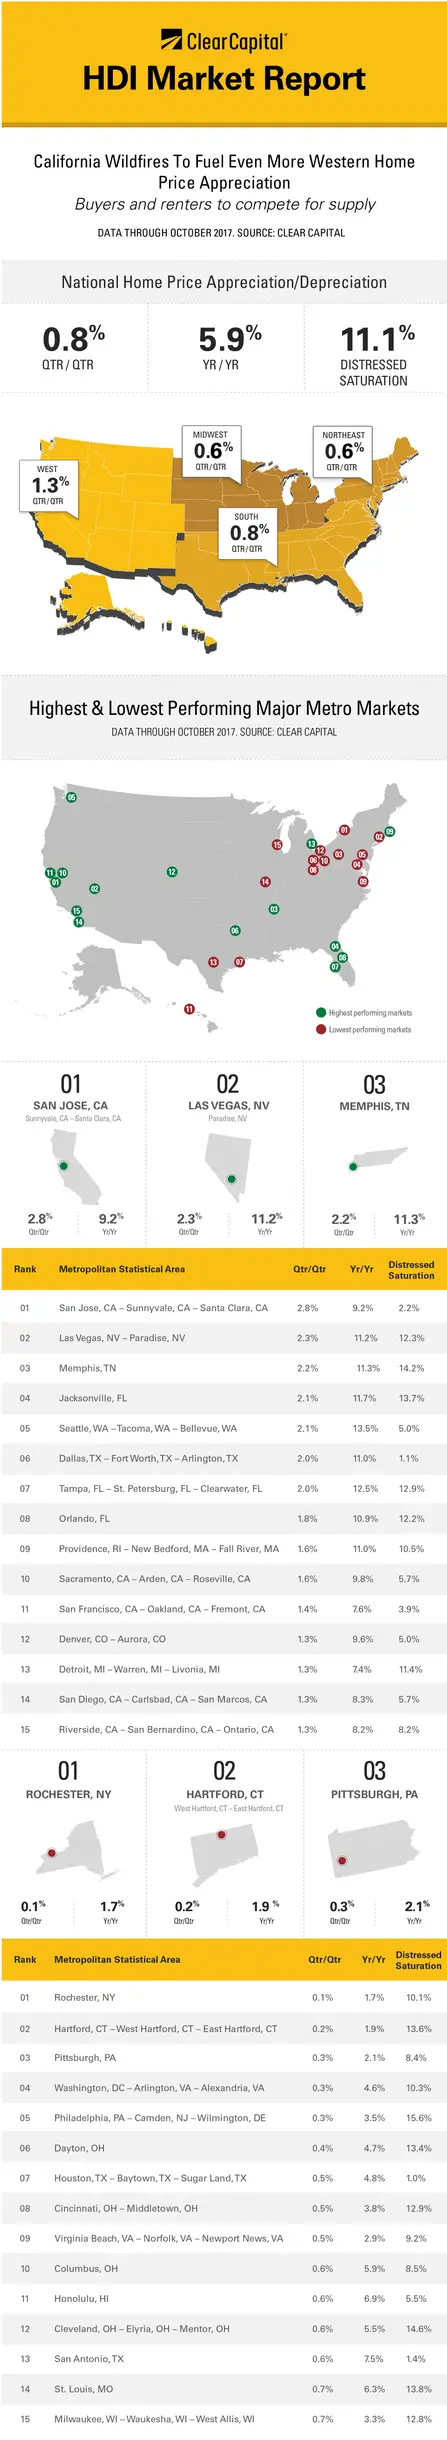
The October HDI data revealed that the entire state of California holds five of the top 15 highest performing major metro markets, which now include San Francisco and Riverside, California. Overall, the West has a secure foothold on home price appreciation with eight of the top 15 fastest growing metros belonging to the region.
Within this region, wildfires in northern California have led to the destruction of about 5,700 structures, including homes and businesses. Most of these structures were single and multi-family homes in Sonoma County. Residents of the region were already suffering from extremely low long-term rental options and a vibrant short-term rental market. The massive loss of housing units in such a low supply market is going to add more stress to those already impacted and access to housing will get even more expensive as time goes on.
“The Western region’s growth is due, in part, to first time home buyers and those looking to re-enter the housing market post-foreclosure during the recession. Along with scarce home inventory and a strong tech economy, home price appreciation is being driven upwards,” said Clear Capital President and Co-Founder Kevin Marshall. “The fires in and around Sonoma County will drive more upward price movement and we’ll likely see near zero inventory,” stated Marshall.
Although the West owns three of the fastest growing metros nationwide, aggregated data revealed that both Las Vegas, Nevada and Seattle, Washington saw declines in October as they moved down the top 15 MSA list to positions two and five, respectively.
The Western region as a whole continues to outperform the South, Northeast and Midwest regions with quarter-over-quarter price growth, showing the West at 1.3 percent, the South at 0.8 percent, the Northeast at 0.6 percent and the Midwest at 0.6 percent. Nationally, home price growth continued to hold steady at 0.8 percent.
The Clear Capital August HDI report features the top 15 appreciating and depreciating MSAs based on quarter-over-quarter and year-over-year data, as well as national performance based on four separate regions: West, Midwest, South and Northeast.
Clear Capital’s HDI platform runs on patent-pending indexing technology and provides housing market data and analysis that assist mortgage lenders and financial organizations with a holistic view of market performance, trends and forecasting.
About the Clear Capital® Home Data Index (HDI) Market Report
The Clear Capital HDI Market Report provides insights into market trends and other leading indices for the real estate market at the national and local levels. A critical difference in the value of the HDI Market Report is the capability of Clear Capital to provide more timely and granular reporting than nearly any other home price index provider.
Clear Capital® HDI Methodology
- Generates the timeliest indices in patent pending rolling quarter intervals that compare the most recent four months to the previous three months. The rolling quarters have no fixed start date and can be used to generate indices as data flows in, significantly reducing the multi-month lag time experienced with other indices.
- Includes both fair market and institutional (real estate owned) transactions, giving equal weight to all market transactions and identifying price tiers at a market specific level. By giving equal weight to all transactions, the HDI is truly representative of each unique market.
- Results from an address-level cascade create an index with the most granular, statistically significant market area available.
- Provides weighted repeat sales and price-per-square-foot index models that use multiple sale types, including single-family homes, multi-family homes, and condominiums.
About Clear Capital®
Clear Capital is a nationwide provider of real estate valuations, data and analytics, quality assurance services and technology solutions. The Company’s customers include mortgage lenders, servicers, investors, GSEs, and Ratings Agencies. Clear Capital products include appraisals, broker price opinions, property condition inspections, value reconciliations, appraisal review and risk scoring, automated valuation models, home data indices, and platform solutions. The Company’s innovative technology, experienced valuation experts, and a well-trained network of more than 30,000 field experts sets a new standard for accurate, up-to-date, and well documented valuation data and assessments. Morningstar Credit Rating issued Clear Capital its highest Residential Vendor Ranking – MOR RV1.
The information contained in this report is based on sources that are deemed to be reliable; however no representation or warranty is made as to the accuracy, completeness, or fitness for any particular purpose of any information contained herein. This report is not intended as investment advice, and should not be viewed as any guarantee of value, condition, or other attribute.